
Federal Reserve Economic Data: Your trusted data source since 1991
Your trusted data source
since 1991.
NOTES
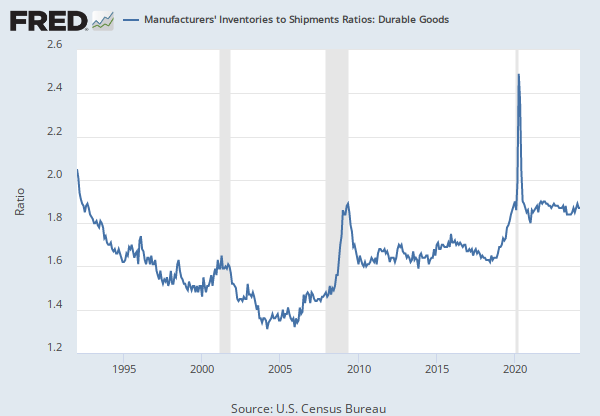
Source: U.S. Census Bureau
Release: Manufacturer's Shipments, Inventories, and Orders (M3) Survey
Units:
Frequency:
Notes:
Unfilled Orders to Shipments Ratio Excludes Semiconductor Manufacturing. Also, the Ratio of Unfilled Orders to Shipments excludes the following industries with no unfilled orders: Wood products; nonmetallic mineral products; medical equipment and supplies; office supplies; other miscellaneous manufacturing; cutlery and handtools; farm and garden machinery; computer storage and peripheral devices; audio and video equipment; manufacturing and reproducing magnetic and optical media; batteries; automobiles; light trucks and utility vehicles; heavy duty trucks; and miscellaneous furniture.
Suggested Citation:
U.S. Census Bureau, Manufacturers' Unfilled Orders to Shipments Ratios: Durable Goods [AMDMUS], retrieved from FRED, Federal Reserve Bank of St. Louis; https://fred.stlouisfed.org/series/AMDMUS, April 25, 2024.
RELATED DATA AND CONTENT
Data Suggestions Based On Your Search


Content Suggestions

