Your trusted data source
since 1991.
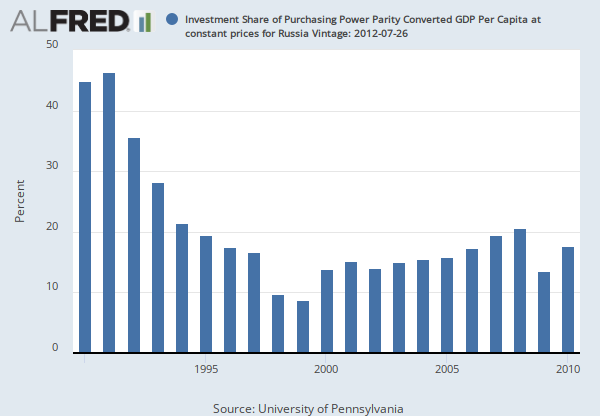
Source: University of Pennsylvania
Release: Penn World Table 7.1
Units:
Frequency:
For more information and proper citation see http://www.rug.nl/research/ggdc/data/pwt/pwt-7.1
Source Indicator: ki
University of Pennsylvania, Investment Share of Purchasing Power Parity Converted GDP Per Capita at constant prices for Russia [KIPPPGRUA156NUPN], retrieved from FRED, Federal Reserve Bank of St. Louis; https://fred.stlouisfed.org/series/KIPPPGRUA156NUPN, April 25, 2024.