FRED Graph

Your trusted data source
since 1991.
Source: Federal Reserve Bank of St. Louis
Release: Money Velocity
Units:
Frequency:
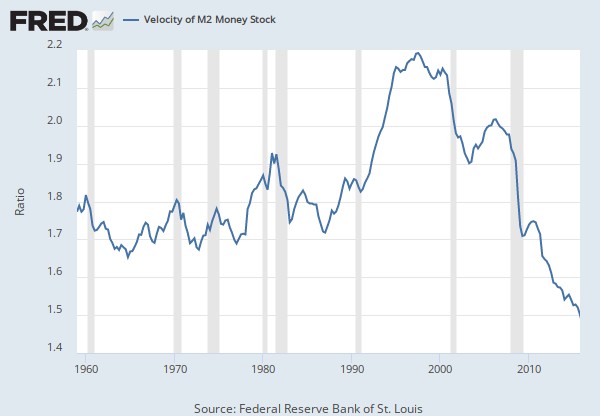
Calculated as the ratio of quarterly nominal GDP to the quarterly average of M2 money stock.
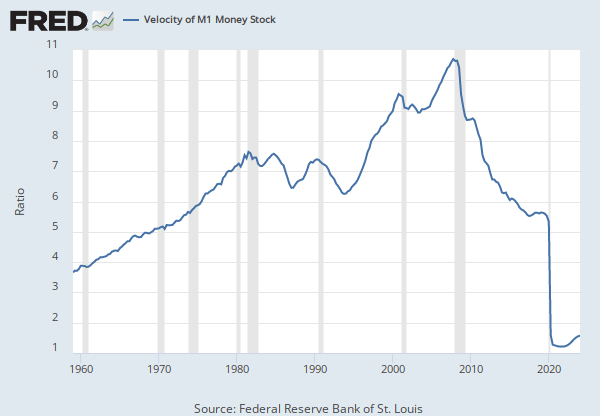
The velocity of money is the frequency at which one unit of currency is used to purchase domestically- produced goods and services within a given time period. In other words, it is the number of times one dollar is spent to buy goods and services per unit of time. If the velocity of money is increasing, then more transactions are occurring between individuals in an economy.
The frequency of currency exchange can be used to determine the velocity of a given component of the money supply, providing some insight into whether consumers and businesses are saving or spending their money. There are several components of the money supply,: M1, M2, and MZM (M3 is no longer tracked by the Federal Reserve); these components are arranged on a spectrum of narrowest to broadest. Consider M1, the narrowest component. M1 is the money supply of currency in circulation (notes and coins, traveler's checks [non-bank issuers], demand deposits, and checkable deposits). A decreasing velocity of M1 might indicate fewer short- term consumption transactions are taking place. We can think of shorter- term transactions as consumption we might make on an everyday basis.
Beginning May 2020, M2 consists of M1 plus (1) small-denomination time deposits (time deposits in amounts of less than $100,000) less IRA and Keogh balances at depository institutions; and (2) balances in retail MMFs less IRA and Keogh balances at MMFs. Seasonally adjusted M2 is constructed by summing savings deposits (before May 2020), small-denomination time deposits, and retail MMFs, each seasonally adjusted separately, and adding this result to seasonally adjusted M1. For more information on the H.6 release changes and the regulatory amendment that led to the creation of the other liquid deposits component and its inclusion in the M1 monetary aggregate, see the H.6 announcements and Technical Q&As posted on December 17, 2020.
MZM (money with zero maturity) is the broadest component and consists of the supply of financial assets redeemable at par on demand: notes and coins in circulation, traveler's checks (non-bank issuers), demand deposits, other checkable deposits, savings deposits, and all money market funds. The velocity of MZM helps determine how often financial assets are switching hands within the economy.
Federal Reserve Bank of St. Louis, Velocity of M2 Money Stock [M2V], retrieved from FRED, Federal Reserve Bank of St. Louis; https://fred.stlouisfed.org/series/M2V, April 18, 2024.
Source: U.S. Census Bureau
Release: Income and Poverty in the United States
Units:
Frequency:
Household data are collected as of March.
Consumer Price Index research series using current methods (CPI-U-RS) presents an estimate of the CPI for all Urban Consumers (CPI-U) that incorporates most of the improvements made over that time span into the entire series. More information can be found at https://www.bls.gov/cpi/research-series/home.htm.
As stated in the Census's "Source and Accuracy of Estimates for Income, Poverty, and Health Insurance Coverage in the United States: 2011" (http://www.census.gov/hhes/www/p60_243sa.pdf):
Estimation of Median Incomes. The Census Bureau has changed the methodology for computing median income over time. The Census Bureau has computed medians using either Pareto interpolation or linear interpolation. Currently, we are using linear interpolation to estimate all medians. Pareto interpolation assumes a decreasing density of population within an income interval, whereas linear interpolation assumes a constant density of population within an income interval. The Census Bureau calculated estimates of median income and associated standard errors for 1979 through 1987 using Pareto interpolation if the estimate was larger than $20,000 for people or $40,000 for families and households. This is because the width of the income interval containing the estimate is greater than $2,500.
We calculated estimates of median income and associated standard errors for 1976, 1977, and 1978 using Pareto interpolation if the estimate was larger than $12,000 for people or $18,000 for families and households. This is because the width of the income interval containing the estimate is greater than $1,000. All other estimates of median income and associated standard errors for 1976 through 2011 (2012 ASEC) and almost all of the estimates of median income and associated standard errors for 1975 and earlier were calculated using linear interpolation.
Thus, use caution when comparing median incomes above $12,000 for people or $18,000 for families and households for different years. Median incomes below those levels are more comparable from year to year since they have always been calculated using linear interpolation. For an indication of the comparability of medians calculated using Pareto interpolation with medians calculated using linear interpolation, see Series P-60, Number 114, Money Income in 1976 of Families and Persons in the United States (www2.census.gov/prod2/popscan/p60-114.pdf).
U.S. Census Bureau, Real Median Household Income in Massachusetts [MEHOINUSMAA672N], retrieved from FRED, Federal Reserve Bank of St. Louis; https://fred.stlouisfed.org/series/MEHOINUSMAA672N, April 18, 2024.