FRED Graph

Your trusted data source
since 1991.
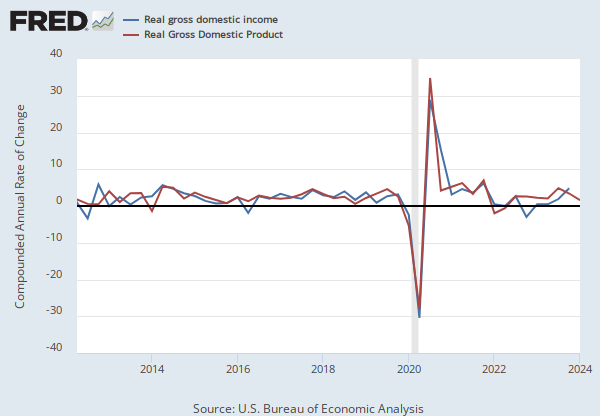
Source: U.S. Bureau of Economic Analysis
Release: Gross Domestic Product
Units:
Frequency:
BEA Account Code: A191RX
Real gross domestic product is the inflation adjusted value of the goods and services produced by labor and property located in the United States.For more information see the Guide to the National Income and Product Accounts of the United States (NIPA). For more information, please visit the Bureau of Economic Analysis.
U.S. Bureau of Economic Analysis, Real Gross Domestic Product [GDPC1], retrieved from FRED, Federal Reserve Bank of St. Louis; https://fred.stlouisfed.org/series/GDPC1, April 24, 2024.
Source: U.S. Census Bureau
Release: National Population Estimates
Units:
Frequency:
The intercensal estimates for 1990-2000 for the United States population are produced by converting the 1990-2000 postcensal estimates prepared previously for the U. S. to account for differences between the postcensal estimates in 2000 and census counts (error of closure). The postcensal estimates for 1990 to 2000 were produced by updating the resident population enumerated in the 1990 census by estimates of the components of population change between April 1, 1990 and April 1, 2000-- births to U.S. resident women, deaths to U.S. residents, net international migration (incl legal & residual foreign born), and net movement of the U.S. armed forces and civilian citizens to the United States. Intercensal population estimates for 1990 to 2000 are derived from the postcensal estimates by distributing the error of closure over the decade by month. The method used for the 1990s for distributing the error of closure is the same that was used for the 1980s. This method produces an intercensal estimate as a function of time and the postcensal estimates,using the following formula: the population at time t is equal to the postcensal estimate at time t multiplied by a function. The function is the April 1, 2000 census count divided by the April 1, 2000 postcensal estimate raised to the power of t divided by 3653.
U.S. Census Bureau, Total Population: All Ages including Armed Forces Overseas [POP], retrieved from FRED, Federal Reserve Bank of St. Louis; https://fred.stlouisfed.org/series/POP, April 24, 2024.
Source: U.S. Census Bureau
Release: Income and Poverty in the United States
Units:
Frequency:
Household data are collected as of March.
As stated in the Census's Source and Accuracy of Estimates for Income, Poverty, and Health Insurance Coverage in the United States: 2011.
Estimation of Median Incomes. The Census Bureau has changed the methodology for computing median income over time. The Census Bureau has computed medians using either Pareto interpolation or linear interpolation. Currently, we are using linear interpolation to estimate all medians. Pareto interpolation assumes a decreasing density of population within an income interval, whereas linear interpolation assumes a constant density of population within an income interval. The Census Bureau calculated estimates of median income and associated standard errors for 1979 through 1987 using Pareto interpolation if the estimate was larger than $20,000 for people or $40,000 for families and households. This is because the width of the income interval containing the estimate is greater than $2,500.
We calculated estimates of median income and associated standard errors for 1976, 1977, and 1978 using Pareto interpolation if the estimate was larger than $12,000 for people or $18,000 for families and households. This is because the width of the income interval containing the estimate is greater than $1,000. All other estimates of median income and associated standard errors for 1976 through 2011 (2012 ASEC) and almost all of the estimates of median income and associated standard errors for 1975 and earlier were calculated using linear interpolation.
Thus, use caution when comparing median incomes above $12,000 for people or $18,000 for families and households for different years. Median incomes below those levels are more comparable from year to year since they have always been calculated using linear interpolation. For an indication of the comparability of medians calculated using Pareto interpolation with medians calculated using linear interpolation, see Series P-60, Number 114, Money Income in 1976 of Families and Persons in the United States.
U.S. Census Bureau, Real Median Household Income in the United States [MEHOINUSA672N], retrieved from FRED, Federal Reserve Bank of St. Louis; https://fred.stlouisfed.org/series/MEHOINUSA672N, April 24, 2024.