Federal Reserve Economic Data: Your trusted data source since 1991
Your trusted data source
since 1991.
NOTES
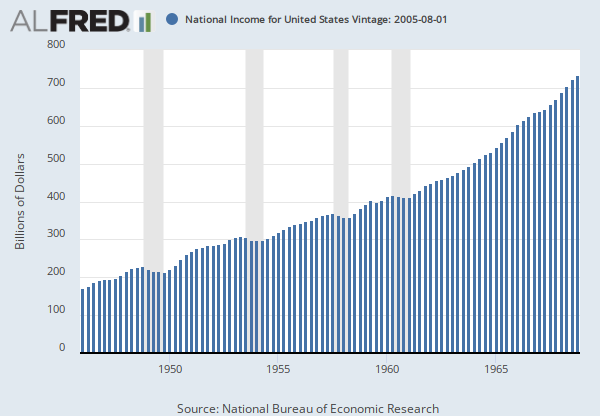
Source: National Bureau of Economic Research
Release: NBER Macrohistory Database
Units:
Frequency:
Notes:
Series Is Presented Here As Two Variables--(1)--Original Data, 1939-1945 (2)--Seasonally Adjusted Data, 1946-1968. For Annual Revisions, See Survey Of Current Business, July, 1968 And Subsequent July Issues; For Quarterly Figures, Also See Survey Of Current Business Monthly Issues. Source: Survey Of Current Business, For 1946-1962: August 1965 Issue; For 1963-1968: July 1966 And Following Monthly Issues. An Alternative Source Is A Survey Of Current Business Supplement Of August 1966, The National Income And Product Accounts Of The United States, 1929-1965 (For Data Until 1963).
This NBER data series q08281b appears on the NBER website in Chapter 8 at http://www.nber.org/databases/macrohistory/contents/chapter08.html.
NBER Indicator: q08281b
Suggested Citation:
National Bureau of Economic Research, National Income for United States [Q0881BUSQ027SNBR], retrieved from FRED, Federal Reserve Bank of St. Louis; https://fred.stlouisfed.org/series/Q0881BUSQ027SNBR, April 19, 2024.
RELATED DATA AND CONTENT
Data Suggestions Based On Your Search


Content Suggestions