Notes
Source: Federal Reserve Bank of St. Louis
Release: Interest Rate Spreads
Units:
Frequency:
Notes:
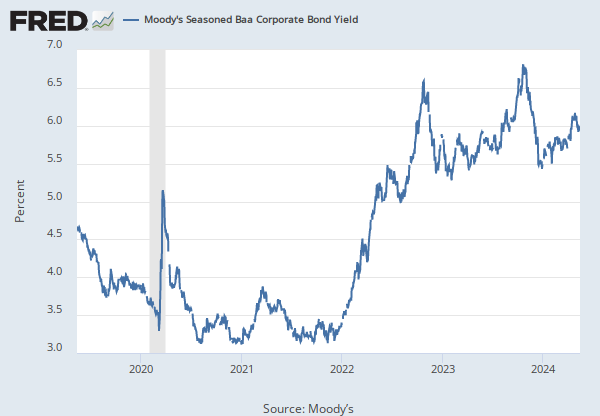
Series is calculated as the spread between Moody's Seasoned Baa Corporate Bond© (https://fred.stlouisfed.org/series/DBAA) and 10-Year Treasury Constant Maturity (BC_10YEAR).
©2017, Moody's Corporation, Moody's Investors Service, Inc., Moody's Analytics, Inc. and/or their licensors and affiliates (collectively, "Moody's"). All rights reserved. Moody's ratings and other information ("Moody's Information") are proprietary to Moody's and/or its licensors and are protected by copyright and other intellectual property laws. Moody's Information is licensed to Client by Moody's. MOODY'S INFORMATION MAY NOT BE COPIED OR OTHERWISE REPRODUCED, REPACKAGED, FURTHER TRANSMITTED, TRANSFERRED, DISSEMINATED, REDISTRIBUTED OR RESOLD, OR STORED FOR SUBSEQUENT USE FOR ANY SUCH PURPOSE, IN WHOLE OR IN PART, IN ANY FORM OR MANNER OR BY ANY MEANS WHATSOEVER, BY ANY PERSON WITHOUT MOODY'S PRIOR WRITTEN CONSENT.
Starting with the update on June 21, 2019, the Treasury bond data used in calculating interest rate spreads is obtained directly from the U.S. Treasury Department.
Suggested Citation:
Federal Reserve Bank of St. Louis, Moody's Seasoned Baa Corporate Bond Yield Relative to Yield on 10-Year Treasury Constant Maturity [BAA10Y], retrieved from FRED, Federal Reserve Bank of St. Louis; https://fred.stlouisfed.org/series/BAA10Y, .
Source: S&P Dow Jones Indices LLC
Release: Standard & Poors
Units:
Frequency:
Notes:
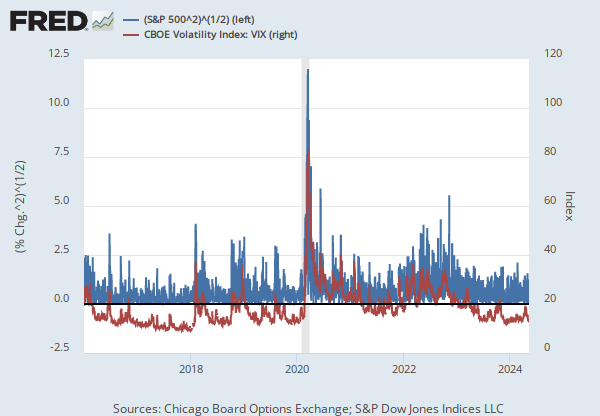
The observations for the S&P 500 represent the daily index value at market close. The market typically closes at 4 PM ET, except for holidays when it sometimes closes early.
The Federal Reserve Bank of St. Louis and S&P Dow Jones Indices LLC have reached a new agreement on the use of Standard & Poors and Dow Jones Averages series in FRED. FRED and its associated services will include 10 years of daily history for Standard & Poors and Dow Jones Averages series.
The S&P 500 is regarded as a gauge of the large cap U.S. equities market. The index includes 500 leading companies in leading industries of the U.S. economy, which are publicly held on either the NYSE or NASDAQ, and covers 75% of U.S. equities. Since this is a price index and not a total return index, the S&P 500 index here does not contain dividends.
Copyright © 2016, S&P Dow Jones Indices LLC. All rights reserved. Reproduction of S&P 500 in any form is prohibited except with the prior written permission of S&P Dow Jones Indices LLC ("S&P"). S&P does not guarantee the accuracy, adequacy, completeness or availability of any information and is not responsible for any errors or omissions, regardless of the cause or for the results obtained from the use of such information. S&P DISCLAIMS ANY AND ALL EXPRESS OR IMPLIED WARRANTIES, INCLUDING, BUT NOT LIMITED TO, ANY WARRANTIES OF MERCHANTABILITY OR FITNESS FOR A PARTICULAR PURPOSE OR USE. In no event shall S&P be liable for any direct, indirect, special or consequential damages, costs, expenses, legal fees, or losses (including lost income or lost profit and opportunity costs) in connection with subscriber's or others' use of S&P 500.
Permission to reproduce S&P 500 can be requested from index_services@spdji.com. More contact details are available here, including phone numbers for all regional offices.
Suggested Citation:
S&P Dow Jones Indices LLC, S&P 500 [SP500], retrieved from FRED, Federal Reserve Bank of St. Louis; https://fred.stlouisfed.org/series/SP500, .
Related Data and Content
Data Suggestions Based On Your Search


Content Suggestions


Other Formats
Related Categories
Interest Rate Spreads
Interest Rates
Money, Banking, & Finance
Stock Market Indexes
Financial Indicators