Federal Reserve Economic Data
Data in this graph are copyrighted. Please review the copyright information in the series notes before sharing.
Notes
Source: U.S. Bureau of Labor Statistics
Release: Employment Situation
Units: Thousands of Persons, Seasonally Adjusted
Frequency: Monthly
Notes:
The series comes from the 'Current Employment Statistics (Establishment Survey).'
The source code is: CES3000000001
Suggested Citation:
U.S. Bureau of Labor Statistics, All Employees, Manufacturing [MANEMP], retrieved from FRED, Federal Reserve Bank of St. Louis; https://fred.stlouisfed.org/series/MANEMP, .
Source: U.S. Bureau of Labor Statistics
Release: Productivity and Costs
Units: Index 2017=100, Seasonally Adjusted
Frequency: Quarterly
Notes:
Effective February 5, 2004, Productivity and Cost measures for the manufacturing sector
are now reported using the 2002 North American Industry Classification System (NAICS).
Because of the reclassification, these measures are not directly comparable with
manufacturing measures published on or before Dec. 3, 2003.
For further information, please visit the Bureau Of Labor Statistics web
site at https://www.bls.gov/lpc/
Suggested Citation:
U.S. Bureau of Labor Statistics, Manufacturing Sector: Real Sectoral Output for All Workers [OUTMS], retrieved from FRED, Federal Reserve Bank of St. Louis; https://fred.stlouisfed.org/series/OUTMS, .
Source: Board of Governors of the Federal Reserve System (US)
Release: G.17 Industrial Production and Capacity Utilization
Units: Index 2017=100, Seasonally Adjusted
Frequency: Monthly
Notes:
The Federal Reserve's monthly index of industrial production and the related capacity indexes and capacity utilization rates cover manufacturing, mining, and electric and gas utilities. The industrial sector, together with construction, accounts for the bulk of the variation in national output over the course of the business cycle. The industrial detail provided by these measures helps illuminate structural developments in the economy. The industrial production (IP) index measures the real output of all relevant establishments located in the United States, regardless of their ownership, but not those located in U.S. territories. For more information, see the explanatory notes issued by the Board of Governors. For recent updates, see the announcements issued by the Board of Governors.
Suggested Citation:
Board of Governors of the Federal Reserve System (US), Industrial Production: Manufacturing (NAICS) [IPMAN], retrieved from FRED, Federal Reserve Bank of St. Louis; https://fred.stlouisfed.org/series/IPMAN, .
Source: U.S. Census Bureau
Release: Manufacturer's Shipments, Inventories, and Orders (M3) Survey
Units: Millions of Dollars, Seasonally Adjusted
Frequency: Monthly
Notes:
Data on New Orders for the Semiconductor Industry are not available.
Suggested Citation:
U.S. Census Bureau, Manufacturers' New Orders: Total Manufacturing [AMTMNO], retrieved from FRED, Federal Reserve Bank of St. Louis; https://fred.stlouisfed.org/series/AMTMNO, .
Source: Board of Governors of the Federal Reserve System (US)
Release: G.17 Industrial Production and Capacity Utilization
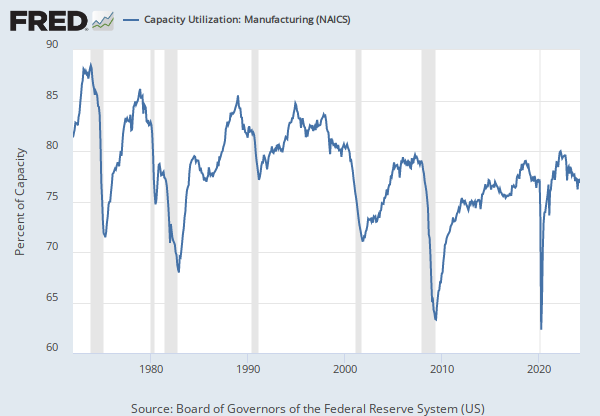
Units: Percent, Seasonally Adjusted
Frequency: Monthly
Notes:
The Federal Reserve Board constructs estimates of capacity and capacity utilization for industries in manufacturing, mining, and electric and gas utilities. For a given industry, the capacity utilization rate is equal to an output index (seasonally adjusted) divided by a capacity index. The Federal Reserve Board's capacity indexes attempt to capture the concept of sustainable maximum output -- the greatest level of output a plant can maintain within the framework of a realistic work schedule, after factoring in normal downtime and assuming sufficient availability of inputs to operate the capital in place.
The Federal Reserve's monthly index of industrial production and the related capacity indexes and capacity utilization rates cover manufacturing, mining, and electric and gas utilities. The industrial sector, together with construction, accounts for the bulk of the variation in national output over the course of the business cycle. The industrial detail provided by these measures helps illuminate structural developments in the economy. The industrial production (IP) index measures the real output of all relevant establishments located in the United States, regardless of their ownership, but not those located in U.S. territories. For more information, see the explanatory notes issued by the Board of Governors. For recent updates, see the announcements issued by the Board of Governors.
Suggested Citation:
Board of Governors of the Federal Reserve System (US), Capacity Utilization: Manufacturing (NAICS) [MCUMFN], retrieved from FRED, Federal Reserve Bank of St. Louis; https://fred.stlouisfed.org/series/MCUMFN, .
Release Tables
- Industrial Production Indexes: Market and Industry Group: Monthly, Seasonally Adjusted
- Capacity Utilization: Monthly, Seasonally Adjusted
Related Data and Content
Data Suggestions Based On Your Search
Content Suggestions
Other Formats
All Employees, Manufacturing
Monthly, Not Seasonally AdjustedManufacturing Sector: Real Sectoral Output for All Workers
Percent Change at Annual Rate, Quarterly, Seasonally Adjusted Percent Change from Quarter One Year Ago, Quarterly, Seasonally AdjustedIndustrial Production: Manufacturing (NAICS)
Annual, Not Seasonally Adjusted Monthly, Not Seasonally Adjusted Quarterly, Not Seasonally Adjusted Quarterly, Seasonally AdjustedManufacturers' New Orders: Total Manufacturing
Monthly, Not Seasonally AdjustedCapacity Utilization: Manufacturing (NAICS)
Annual, Seasonally Adjusted Quarterly, Seasonally AdjustedRelated Categories
Releases
Tags
Permalink/Embed
modal open, choose link customization options
Select automatic updates to the data or a static time frame. All data are subject to revision.


