Notes
Source: U.S. Bureau of Labor Statistics
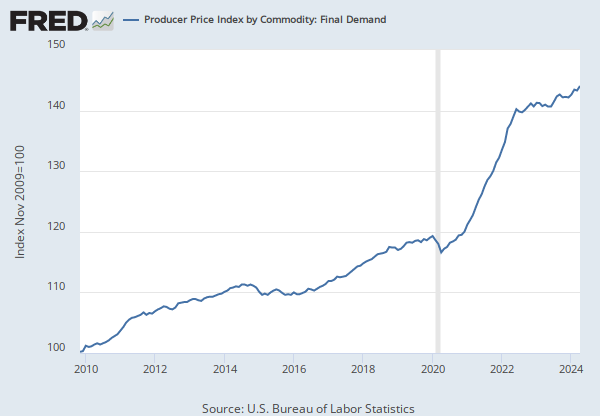
Release: Producer Price Index
Units:
Frequency:
Suggested Citation:
U.S. Bureau of Labor Statistics, Producer Price Index by Commodity: Final Demand [PPIFIS], retrieved from FRED, Federal Reserve Bank of St. Louis; https://fred.stlouisfed.org/series/PPIFIS, .
Source: U.S. Bureau of Labor Statistics
Release: Producer Price Index
Units:
Frequency:
Suggested Citation:
U.S. Bureau of Labor Statistics, Producer Price Index by Commodity: Final Demand: Final Demand Less Foods and Energy [PPIFES], retrieved from FRED, Federal Reserve Bank of St. Louis; https://fred.stlouisfed.org/series/PPIFES, .
Release Tables
Related Data and Content
Data Suggestions Based On Your Search


Content Suggestions


Other Formats
Producer Price Index by Commodity: Final Demand
Monthly, Not Seasonally AdjustedProducer Price Index by Commodity: Final Demand: Final Demand Less Foods and Energy
Monthly, Not Seasonally Adjusted