10-Year Breakeven Inflation Rate-0.35 (T10YIE)
10-Year Breakeven Inflation Rate
Customize data:
Write a custom formula to transform one or more series or combine two or more series.
You can begin by adding a series to combine with your existing series.
Now create a custom formula to combine or transform the series.
Need help? []
For example, invert an exchange rate by using formula 1/a, where “a” refers to the first FRED data series added to this line. Or calculate the spread between 2 interest rates, a and b, by using the formula a - b.
Use the assigned data series variables (a, b, c, etc.) together with operators (+, -, *, /, ^, etc.), parentheses {(,)}, and constants (1, 1.5, 2, etc.) to create your own formula (e.g., 1/a, a-b, (a+b)/2, (a/(a+b+c))*100). As noted above, you may add other data series to this line before entering a formula.
Finally, you can change the units of your new series.
Add data series to graph:
Data in this graph are copyrighted. Please review the copyright information in the series notes before sharing.
Source: Federal Reserve Bank of St. Louis
Release: Interest Rate Spreads
Units: Percent, Not Seasonally Adjusted
Frequency: Daily
Notes:
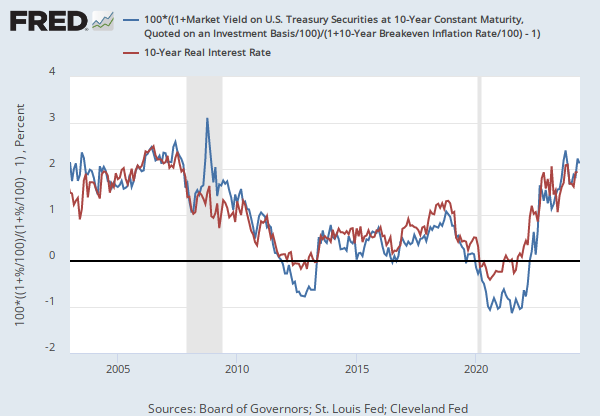
The breakeven inflation rate represents a measure of expected inflation derived from 10-Year Treasury Constant Maturity Securities (https://fred.stlouisfed.org/series/DGS10 ) and 10-Year Treasury Inflation-Indexed Constant Maturity Securities (https://fred.stlouisfed.org/series/DFII10 ). The latest value implies what market participants expect inflation to be in the next 10 years, on average.
Suggested Citation:
Federal Reserve Bank of St. Louis, 10-Year Breakeven Inflation Rate [T10YIE], retrieved from FRED, Federal Reserve Bank of St. Louis; https://fred.stlouisfed.org/series/T10YIE, April 24, 2018.
Related Resources
Other Formats
Related Categories
Sources
Releases
Tags
Confirm Delete
Are you sure you want to remove this series from the graph? This can not be undone.