Federal Reserve Economic Data

S&P CoreLogic Case-Shiller 20-City Composite Home Price Index/Consumer Price Index for All Urban Consumers: Owners' Equivalent Rent of Residences in U.S. City Average *100

1Y5Y10YMax
to
Date:
Line 1
(a) S&P CoreLogic Case-Shiller 20-City Composite Home Price Index, Index Jan 2000=100, Seasonally Adjusted (SPCS20RSA)
For more information regarding the index, please visit Standard and Poor's (https://us.spindices.com/index-family/sp-corelogic-case-shiller/sp-corelogic-case-shiller-composite). Copyright © 2016, S&P Dow Jones Indices LLC. All rights reserved. Reproduction of S&P Case-Shiller 20-City Home Price Index in any form is prohibited except with the prior written permission of S&P Dow Jones Indices LLC "S&P". S&P does not guarantee the accuracy, adequacy, completeness or availability of any information and is not responsible for any errors or omissions, regardless of the cause or for the results obtained from the use of such information. S&P DISCLAIMS ANY AND ALL EXPRESS OR IMPLIED WARRANTIES, INCLUDING, BUT NOT LIMITED TO, ANY WARRANTIES OF MERCHANTABILITY OR FITNESS FOR A PARTICULAR PURPOSE OR USE. In no event shall S&P be liable for any direct, indirect, special or consequential damages, costs, expenses, legal fees, or losses (including lost income or lost profit and opportunity costs) in connection with subscriber's or others' user of S&P Case-Shiller 20-City Home Price Index. Permission to reproduce this series can be requested from index_services@spdji.com. More contact details (http://us.spindices.com/contact-us/) are available, including phone numbers for all regional offices.

Select a date that will equal 100 for your custom index:
  Enter date as YYYY-MM-DD
(b) Consumer Price Index for All Urban Consumers: Owners' Equivalent Rent of Residences in U.S. City Average, Index Dec 1982=100, Seasonally Adjusted (CUSR0000SEHC)

Select a date that will equal 100 for your custom index:
  Enter date as YYYY-MM-DD
to

Write a custom formula to transform one or more series or combine two or more series.

You can begin by adding a series to combine with your existing series.

Type keywords to search for data

    Now create a custom formula to combine or transform the series.

    For example, invert an exchange rate by using formula 1/a, where “a” refers to the first FRED data series added to this line. Or calculate the spread between 2 interest rates, a and b, by using the formula a - b.

    Use the assigned data series variables (a, b, c, etc.) together with operators (+, -, *, /, ^, etc.), parentheses and constants (1, 1.5, 2, etc.) to create your own formula (e.g., 1/a, a-b, (a+b)/2, (a/(a+b+c))*100). As noted above, you may add other data series to this line before entering a formula.

    Finally, you can change the units of your new series.

    Select a date that will equal 100 for your custom index:
        Enter date as YYYY-MM-DD

    ADDLINE
    Type keywords to search for data
    Create user-defined line
    You can customize a graph by adding a straight line between two data points.
    FORMAT GRAPH
    Details
    Display
    Customize
    Frame
    Plot area
    Text

    Line 1
    S&P CoreLogic Case-Shiller 20-City Composite Home Price Index, Jan 2000=100/Consumer Price Index for All Urban Consumers: Owners' Equivalent Rent of Residences in U.S. City Average, Jan 2000=100 *100
    Line details & color

    Line style, thickness, color and position


    Fullscreen

    Notes

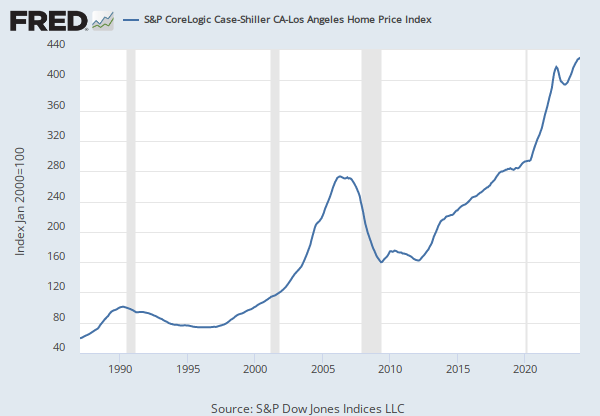
    Source: S&P Dow Jones Indices LLC  

    Release: S&P CoreLogic Case-Shiller Home Price Indices  

    Units:  Index Jan 2000=100, Seasonally Adjusted

    Frequency:  Monthly

    Notes:

    For more information regarding the index, please visit Standard and Poor's.

    Copyright © 2016, S&P Dow Jones Indices LLC. All rights reserved. Reproduction of S&P Case-Shiller 20-City Home Price Index in any form is prohibited except with the prior written permission of S&P Dow Jones Indices LLC "S&P". S&P does not guarantee the accuracy, adequacy, completeness or availability of any information and is not responsible for any errors or omissions, regardless of the cause or for the results obtained from the use of such information. S&P DISCLAIMS ANY AND ALL EXPRESS OR IMPLIED WARRANTIES, INCLUDING, BUT NOT LIMITED TO, ANY WARRANTIES OF MERCHANTABILITY OR FITNESS FOR A PARTICULAR PURPOSE OR USE. In no event shall S&P be liable for any direct, indirect, special or consequential damages, costs, expenses, legal fees, or losses (including lost income or lost profit and opportunity costs) in connection with subscriber's or others' user of S&P Case-Shiller 20-City Home Price Index.

    Permission to reproduce this series can be requested from index_services@spdji.com. More contact details are available, including phone numbers for all regional offices.

    Suggested Citation:

    S&P Dow Jones Indices LLC, S&P CoreLogic Case-Shiller 20-City Composite Home Price Index [SPCS20RSA], retrieved from FRED, Federal Reserve Bank of St. Louis; https://fred.stlouisfed.org/series/SPCS20RSA, April 5, 2025.

    Source: U.S. Bureau of Labor Statistics  

    Release: Consumer Price Index  

    Units:  Index Dec 1982=100, Seasonally Adjusted

    Frequency:  Monthly

    Suggested Citation:

    U.S. Bureau of Labor Statistics, Consumer Price Index for All Urban Consumers: Owners' Equivalent Rent of Residences in U.S. City Average [CUSR0000SEHC], retrieved from FRED, Federal Reserve Bank of St. Louis; https://fred.stlouisfed.org/series/CUSR0000SEHC, April 5, 2025.

    Related Data and Content

    Data Suggestions Based On Your Search

    Content Suggestions

    Other Formats

    S&P CoreLogic Case-Shiller 20-City Composite Home Price Index

    Monthly, Not Seasonally Adjusted

    Consumer Price Index for All Urban Consumers: Owners' Equivalent Rent of Residences in U.S. City Average

    Monthly, Not Seasonally Adjusted Semiannual, Not Seasonally Adjusted

    Related Categories

    Releases

    Tags


    Subscribe to the FRED newsletter


    Follow us

    Back to Top
    Color format