Notes
Source: U.S. Census Bureau
Release: Manufacturing and Trade Inventories and Sales
Units:
Frequency:
Notes:
The inventories to sales ratios show the relationship of the end-of-month values of inventory to the monthly sales. These ratios can be looked at as indications of the number of months of inventory that are on hand in relation to the sales for a month. For example, a ratio of 2.5 would indicate that wholesalers have enough merchandise on hand to cover two and a half months of sales.
Suggested Citation:
U.S. Census Bureau, Merchant Wholesalers: Inventories to Sales Ratio [WHLSLRIRSA], retrieved from FRED, Federal Reserve Bank of St. Louis; https://fred.stlouisfed.org/series/WHLSLRIRSA, .
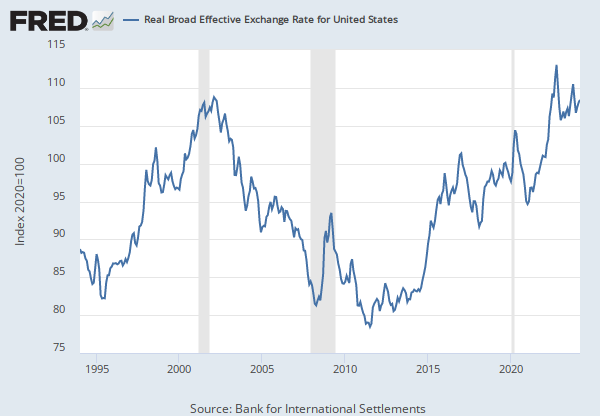
Source: Bank for International Settlements
Release: BIS Effective Exchange Rate Indices
Units:
Frequency:
Notes:
Real effective exchange rates are calculated as weighted averages of bilateral exchange rates adjusted by relative consumer prices.
Copyright, 2016, Bank for International Settlements (BIS). Terms and conditions of use are available at http://www.bis.org/terms_conditions.htm#Copyright_and_Permissions.
Suggested Citation:
Bank for International Settlements, Real Narrow Effective Exchange Rate for United States [RNUSBIS], retrieved from FRED, Federal Reserve Bank of St. Louis; https://fred.stlouisfed.org/series/RNUSBIS, .
Release Tables
BIS Effective Exchange Rate Indices
Manufacturing and Trade Inventories and Sales
Related Data and Content
Data Suggestions Based On Your Search


Content Suggestions


Other Formats
Related Categories
Wholesale Trade
Production & Business Activity
Exchange Rate
Money, Banking, & Finance
Indicators
United States
Countries
International Data
Releases
More
Series from Manufacturing and Trade Inventories and Sales
More
Series from BIS Effective Exchange Rate Indices
Tags
Manufacturing & Trade Inventories and Sales
Merchant
Wholesale
Inventories
Ratio
Sales
Seasonally Adjusted
Census
Monthly
Nation
Public Domain: Citation Requested
United States of America
Narrow
Bank for International Settlements
Exchange Rate
Currency
Real
Rate
Indexes
Copyrighted: Citation Required
Not Seasonally Adjusted