Federal Reserve Economic Data
Notes
Source: National Bureau of Economic Research
Release: NBER Macrohistory Database
Units:
Frequency:
Notes:
Data For August-November, 1914 Are Interpolated, As The Stock Exchange Was Closed. Source: Commercial And Financial Chronicle
This NBER data series m11002 appears on the NBER website in Chapter 11 at http://www.nber.org/databases/macrohistory/contents/chapter11.html.
NBER Indicator: m11002
Suggested Citation:
National Bureau of Economic Research, Stocks, Number of Shares Sold on the New York Stock Exchange for United States [M11002USM444NNBR], retrieved from FRED, Federal Reserve Bank of St. Louis; https://fred.stlouisfed.org/series/M11002USM444NNBR, .
Source: National Bureau of Economic Research
Release: NBER Macrohistory Database
Units:
Frequency:
Notes:
1889-1897 Data Were Taken From The New York Times Issues Beginning In 1905. A Table Was Published Once Monthly Under The Heading Of "Stock Transactions" Which Gives The Figures For That Month Back To 1889. The Table Contains Many Obvious Errors And Misprints--The Latter Being Carried On After Being Misprinted. These 1905 Tables Are The Earliest Appearance Of The Figures For 1889-1897. The Stock Exchange Was Closed August-November, 1914. The Total For 1914 Is For The Eight Remaining Months. Beginning In 1939, The Prices Are As "Reported" (Trade Dates, Rather Than Settlement Dates). The Prices Are Also In The Survey Of Current Business As "Face Value, Exclusive Of Stopped Sales." Source: 1889-1897 Data Are From The New York Times. 1898-1938 Data Are From The New York Stock Exchange (Nyse) Bulletin, August, 1934, Pp.10A To 10B, January, 1935, P.11, And Following Issues. 1939 Data Are From The Nyse Yearbook For 1940. January-April And October-December, 1940, And January-April, 1941 Data Are From "The Exchange." May-September, 1940, Quotations Are From The Nyse Statistical Compilations. 1942-1943 Data Are From"The Exchange." For 1944 And Following Years Data Are From Bank And Quotation Journal.
This NBER data series m11001 appears on the NBER website in Chapter 11 at http://www.nber.org/databases/macrohistory/contents/chapter11.html.
NBER Indicator: m11001
Suggested Citation:
National Bureau of Economic Research, Bond Sales, Par Value for United States [M11001USM144NNBR], retrieved from FRED, Federal Reserve Bank of St. Louis; https://fred.stlouisfed.org/series/M11001USM144NNBR, .
Source: National Bureau of Economic Research
Release: NBER Macrohistory Database
Units:
Frequency:
Notes:
Source: Business Cycle Developments, September 1965 And Subsequent Issues. An Alternate Source Is The National Income And Product Accounts Of The United States, 1929-1965; A Supplement To The Survey Of Current Business, August 1966
This NBER data series q09080 appears on the NBER website in Chapter 9 at http://www.nber.org/databases/macrohistory/contents/chapter09.html.
NBER Indicator: q09080
Suggested Citation:
National Bureau of Economic Research, Ratio of Profits (After Taxes) to Income Originating, Corporate, All Industries for United States [Q09080USQ156SNBR], retrieved from FRED, Federal Reserve Bank of St. Louis; https://fred.stlouisfed.org/series/Q09080USQ156SNBR, .
Source: U.S. Department of the Treasury. Internal Revenue Service
Release: SOI Tax Stats - Historical Data Tables
Units:
Frequency:
Notes:
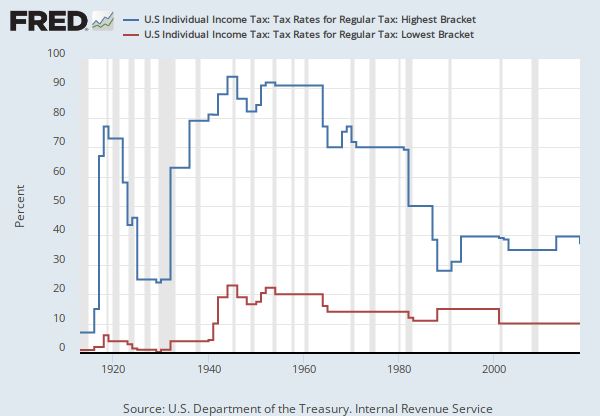
Years represent the tax years .Starting with 1985, tax bracket boundaries were indexed for inflation, using the U.S. Department of Labor Consumer Price Index for Urban Consumers (CPS-U).
As stated by the source, tax rates shown are for the regular income tax, i.e., for normal tax and surtax, applicable to U.S. citizens and residents. Therefore, the rates exclude provisions unique to nonresident aliens. Tax rates exclude the effect of tax credits (which reduce the tax liability), except as noted, and several specific add-on or other taxes applicable to all or some tax years. Excluded are the war excess profits tax (1917), victory tax (1942-1943), Social Security self-employment tax (starting with 1951), tax under the income averaging provisions (1964-1986) and under the farm income averaging provisions (starting with 1998), and the recapture taxes resulting from having to recompute and pay back certain tax credits in later years (starting with 1963), the maximum tax on earned income or on personal service income (1971-1981), the minimum tax on tax preferences (1970-1983), and the alternative minimum tax on tax preferences (starting with 1979).
Also excluded are such other taxes as the tax on recipients of accumulation distributions of trusts (starting with 1954) and the special averaging tax or multiple recipient special averaging tax on recipients of lump-sum distributions from qualified retirement plans (starting with 1974). In addition, data excludes the taxes associated with the preferential treatment of capital gains, starting with 1922 (although certain gains received preferential treatment as early as 1918). At various times, these treatments have taken the form of special tax rates; special definitions; different asset holding periods; ceilings on taxes; and exclusions from income. Included among these special treatments were alternative tax (1938-1986) and its variations for the earlier years, although all of these taxes were in some way tied to a structure for regular tax.
Until 1948, a single set of tax rates applied to all taxpayers, regardless of marital or filing status, and married couples filing joint returns were taxed on the combined income of each spouse. However, a second, lower set of rates was introduced, starting with 1948, for married couples filing jointly. To simplify the data presentation for these more recent years, only the lowest and highest tax rates for married persons filing jointly are shown. Under this change, the combined tax of husband and wife became twice the combined tax that would have applied if their combined taxable income (net income for years before 1954) were cut in half. Thus, taxpayers using the joint return filing status split their incomes for tax purposes, in effect doubling the width of their taxable income (or net income) size brackets. The lowest and highest tax rate brackets are, therefore, the brackets for married couples filing jointly that result from taking into account this doubling of the bracket widths. Starting with 1952, a third set of rates was introduced (not shown) for heads of household, i.e., for unmarried individuals who paid over half the cost of maintaining a home for a qualifying person (e.g., a child or parent), or for certain married individuals who had lived apart from their spouses for the last 6 months of the tax year. This filing status was liberalized, starting with 1970, and provides approximately half the advantage of the income-splitting described above. Starting with 1954, the full benefits of income-splitting allowed married couples filing jointly (i.e., the same tax rates and taxable income brackets) were extended to a new, fourth filing status, surviving spouse (i.e., individuals widowed for 1 to 2 years following the death of a spouse, provided they had a dependent child and had not remarried). The remaining filing status was for single persons, who used the rates formerly applicable to taxpayers in general. However, these latter rates were moderated, starting with 1969, by limiting the tax so that it would not exceed 20 percent more than the tax on married couples filing jointly. One result of the 1969 law change was that certain married couples filing jointly had to pay more tax than they would have paid if each spouse had filed separately. To help mitigate this effect, a special deduction in computing adjusted gross income was allowed for 1982-1986 for two-earner couples filing jointly. This deduction was initially 5 percent of the lesser of $30,000 or the earned income of the spouse with the lesser earnings. The percentage was increased to 10 percent, starting with 1983. The deduction provision was repealed, starting with 1987, when new, lower rates and a reduced number of tax brackets began.
For tax years preceding 1954, the lowest tax rate was either the rate for the basic normal tax (if there was just one rate for normal tax) or the lowest of the several rates for normal tax (if there was more than one rate for normal tax).
The highest tax rate was the sum of the uppermost of the graduated rates (if any) for normal tax, plus the uppermost of the additional, graduated surtax rates, provided that both rates were applied to the same income. For example, for 1932, there were two graduated rates for normal tax, 4 percent (on the first $4,000 of income) and 8 percent (on all income over $4,000), and graduated rates for surtax that ranged from 1 percent to 55 percent. The lowest rate for 1932 is, therefore, shown as 4 percent (the lower of the two normal tax rates) and the highest rate as 63 percent (the sum of the 8-percent higher, graduated rate for normal tax on income over $4,000, plus 55 percent, the highest of the graduated, surtax rates, on income over $1 million.). As another example, for 1941, there was just one rate for normal tax, 4 percent, but it applied to all income. The lowest of the surtax rates, 6 percent, was applied to all income under $2,000, so that income under $2,000 was taxed at both the 4-percent normal tax rate and the 6-percent surtax rate. Therefore, the lowest rate for 1941 is 10 percent, the sum of these two tax rates. The highest rate is the sum of the 4-percent normal tax on total statutory net income, plus the highest graduated surtax rate, 77 percent on income over $5 million, so that income over $5 million was taxed at 81.0 percent, the sum of the two rates.
For tax years starting with 1954, normal tax and surtax rates were, in effect, combined into a single rate structure.
For more information on the specific adjustments, see Appendix to Selected Historical and Other Data Tables at https://www.irs.gov/uac/soi-tax-stats-historical-table-23
Suggested Citation:
U.S. Department of the Treasury. Internal Revenue Service, U.S Individual Income Tax: Tax Rates for Regular Tax: Highest Bracket [IITTRHB], retrieved from FRED, Federal Reserve Bank of St. Louis; https://fred.stlouisfed.org/series/IITTRHB, .
Source: Board of Governors of the Federal Reserve System (US)
Release: Z.1 Financial Accounts of the United States
Units:
Frequency:
Notes:
For more information about the Flow of Funds tables, see the Financial Accounts Guide.
With each quarterly release, the source may make major data and structural revisions to the series and tables. These changes are available in the Release Highlights.
In the Financial Accounts, the source identifies each series by a string of patterned letters and numbers. For a detailed description, including how this series is constructed, see the series analyzer provided by the source.
Suggested Citation:
Board of Governors of the Federal Reserve System (US), All Sectors; Corporate Equities; Asset, Level [BOGZ1FL893064105Q], retrieved from FRED, Federal Reserve Bank of St. Louis; https://fred.stlouisfed.org/series/BOGZ1FL893064105Q, .
Source: Board of Governors of the Federal Reserve System (US)
Release: Z.1 Financial Accounts of the United States
Units:
Frequency:
Notes:
For more information about the Flow of Funds tables, see the Financial Accounts Guide.
With each quarterly release, the source may make major data and structural revisions to the series and tables. These changes are available in the Release Highlights.
In the Financial Accounts, the source identifies each series by a string of patterned letters and numbers. For a detailed description, including how this series is constructed, see the series analyzer provided by the source.
Suggested Citation:
Board of Governors of the Federal Reserve System (US), All Sectors; Corporate Equities; Asset, Transactions [BOGZ1FA893064105Q], retrieved from FRED, Federal Reserve Bank of St. Louis; https://fred.stlouisfed.org/series/BOGZ1FA893064105Q, .
Release Tables
Z.1 Financial Accounts of the United States
Related Data and Content
Data Suggestions Based On Your Search


Content Suggestions


Other Formats
All Sectors; Corporate Equities; Asset, Level
Annual, Not Seasonally AdjustedAll Sectors; Corporate Equities; Asset, Transactions
Annual, Not Seasonally Adjusted Annual, Seasonally Adjusted Annual Rate Quarterly, Not Seasonally AdjustedRelated Categories
Security Markets
NBER Macrohistory Database
Academic Data
Financial Status of Business
Tax Data
Population, Employment, & Labor Markets
Flow of Funds
National Accounts
Releases
More
Series from NBER Macrohistory Database
More
Series from SOI Tax Stats - Historical Data Tables
More
Series from Z.1 Financial Accounts of the United States
Tags
Stock Market
National Bureau of Economic Research
Copyrighted: Citation Required
Monthly
Nation
United States of America
Not Seasonally Adjusted
Bonds
Sales
Ratio
Corporate
Income
Industry
Quarterly
Seasonally Adjusted
Internal Revenue Service
Individual
Tax
Rate
Annual
Public Domain: Citation Requested
Equity
Sector
Assets
Z.1 US Financial Accounts
Board of Governors
Transactions