Notes
Source: Board of Governors of the Federal Reserve System (US)
Release: Distributional Financial Accounts
Units:
Frequency:
Notes:
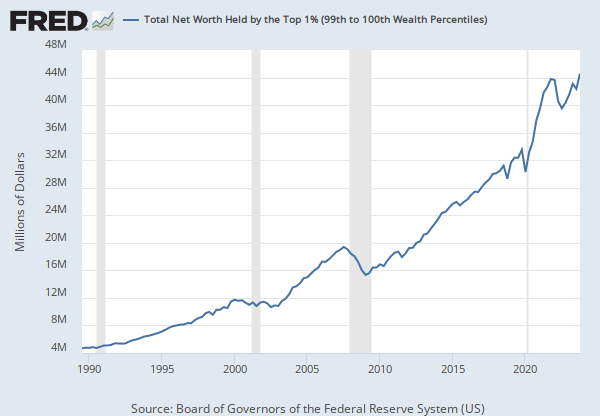
The Distributional Financial Accounts (DFAs) integrate two data products produced by the Federal Reserve Board: the Financial Accounts of the United States, which provide quarterly data on aggregate balance sheets of major sectors of the U.S. economy, and the Survey of Consumer Finances (SCF), which provides comprehensive triennial microdata on the assets and liabilities of a representative sample of U.S. households.
Information on the data collection process can be found at the Board of Governors."
Suggested Citation:
Board of Governors of the Federal Reserve System (US), Net Worth Held by the Top 1% (99th to 100th Wealth Percentiles) [WFRBLT01026], retrieved from FRED, Federal Reserve Bank of St. Louis; https://fred.stlouisfed.org/series/WFRBLT01026, .
Source: Board of Governors of the Federal Reserve System (US)
Release: Distributional Financial Accounts
Units:
Frequency:
Notes:
The Distributional Financial Accounts (DFAs) integrate two data products produced by the Federal Reserve Board: the Financial Accounts of the United States, which provide quarterly data on aggregate balance sheets of major sectors of the U.S. economy, and the Survey of Consumer Finances (SCF), which provides comprehensive triennial microdata on the assets and liabilities of a representative sample of U.S. households.
Information on the data collection process can be found at the Board of Governors."
Suggested Citation:
Board of Governors of the Federal Reserve System (US), Net Worth Held by the 90th to 99th Wealth Percentiles [WFRBLN09053], retrieved from FRED, Federal Reserve Bank of St. Louis; https://fred.stlouisfed.org/series/WFRBLN09053, .
Source: Board of Governors of the Federal Reserve System (US)
Release: Distributional Financial Accounts
Units:
Frequency:
Notes:
The Distributional Financial Accounts (DFAs) integrate two data products produced by the Federal Reserve Board: the Financial Accounts of the United States, which provide quarterly data on aggregate balance sheets of major sectors of the U.S. economy, and the Survey of Consumer Finances (SCF), which provides comprehensive triennial microdata on the assets and liabilities of a representative sample of U.S. households.
Information on the data collection process can be found at the Board of Governors."
Suggested Citation:
Board of Governors of the Federal Reserve System (US), Net Worth Held by the 50th to 90th Wealth Percentiles [WFRBLN40080], retrieved from FRED, Federal Reserve Bank of St. Louis; https://fred.stlouisfed.org/series/WFRBLN40080, .
Source: Board of Governors of the Federal Reserve System (US)
Release: Distributional Financial Accounts
Units:
Frequency:
Notes:
The Distributional Financial Accounts (DFAs) integrate two data products produced by the Federal Reserve Board: the Financial Accounts of the United States, which provide quarterly data on aggregate balance sheets of major sectors of the U.S. economy, and the Survey of Consumer Finances (SCF), which provides comprehensive triennial microdata on the assets and liabilities of a representative sample of U.S. households.
Information on the data collection process can be found at the Board of Governors."
Suggested Citation:
Board of Governors of the Federal Reserve System (US), Net Worth Held by the Bottom 50% (1st to 50th Wealth Percentiles) [WFRBLB50107], retrieved from FRED, Federal Reserve Bank of St. Louis; https://fred.stlouisfed.org/series/WFRBLB50107, .
Release Tables
Distributional Financial Accounts