Federal Reserve Economic Data
Notes
Source: U.S. Census Bureau
Release: Annual Estimates of the Population of Metropolitan and Micropolitan Statistical Areas
Units:
Frequency:
Notes:
All observations are July 1 estimates of each year.
Suggested Citation:
U.S. Census Bureau, Resident Population in Las Vegas-Henderson-Paradise, NV (MSA) [LSVPOP], retrieved from FRED, Federal Reserve Bank of St. Louis; https://fred.stlouisfed.org/series/LSVPOP, .
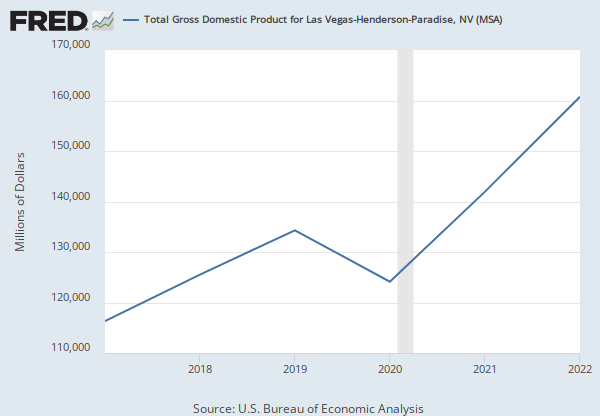
Source: U.S. Bureau of Economic Analysis
Release: Gross Domestic Product by County and Metropolitan Area
Units:
Frequency:
Notes:
The All industry total includes all Private industries and Government.
Gross domestic product (GDP) by metropolitan area is the measure of the market value of all final goods and services produced within a metropolitan area in a particular period of time. In concept, an industry's GDP by metropolitan area, referred to as its "value added", is equivalent to its gross output (sales or receipts and other operating income, commodity taxes, and inventory change) minus its intermediate inputs (consumption of goods and services purchased from other U.S. industries or imported). GDP by metropolitan area is the metropolitan area counterpart of the nation's, BEA's featured measure of U.S. production.
For more information about this release go to http://www.bea.gov/newsreleases/regional/gdp_metro/gdp_metro_newsrelease.htm.
Suggested Citation:
U.S. Bureau of Economic Analysis, Total Gross Domestic Product for Las Vegas-Henderson-Paradise, NV (MSA) [NGMP29820], retrieved from FRED, Federal Reserve Bank of St. Louis; https://fred.stlouisfed.org/series/NGMP29820, .
Source: U.S. Department of Labor
Release: Minimum Wage Rate by State
Units:
Frequency:
Notes:
State minimum wage applies only if employer provides healthcare benefits. State minimum wage is changed annually based on changes in the CPI and a cost of living formula.
For the years 1976-1978, the displayed wage represents the largest minimum wage paid. Some individuals newly covered under state law received a lower wage.
For more information, visit https://www.dol.gov/whd/state/stateMinWageHis.htm
Suggested Citation:
U.S. Department of Labor, State Minimum Wage Rate for Nevada [STTMINWGNV], retrieved from FRED, Federal Reserve Bank of St. Louis; https://fred.stlouisfed.org/series/STTMINWGNV, .
Source: U.S. Census Bureau
Release: Residential Vacancies and Homeownership Annual Statistics
Units:
Frequency:
Suggested Citation:
U.S. Census Bureau, Rental Vacancy Rate for Nevada [NVRVAC], retrieved from FRED, Federal Reserve Bank of St. Louis; https://fred.stlouisfed.org/series/NVRVAC, .
Source: Equifax
Source: Federal Reserve Bank of New York
Release: Equifax Credit Quality
Units:
Frequency:
Notes:
Estimate of the percentage of the population with a credit score below 660. Counties with fewer than 20 people in the sample are not reported for privacy reasons. The estimate is based on the representative primary sample of the New York Fed Consumer Credit Panel, which includes only the primary sample member per household (about 5% of the U.S. credit report population, defined as all U.S. residents with a credit history). For more details about the data and sample, see "An Introduction to the Consumer Credit Panel".
Source: Federal Reserve Bank of New York/Equifax Consumer Credit Panel
Reprinted with permission. Copyright © 2016, Equifax. All rights reserved. Reproduction of median credit score per county in any form is prohibited except with the prior written permission of Equifax.
Suggested Citation:
Equifax and Federal Reserve Bank of New York, Equifax Subprime Credit Population for Clark County, NV [EQFXSUBPRIME032003], retrieved from FRED, Federal Reserve Bank of St. Louis; https://fred.stlouisfed.org/series/EQFXSUBPRIME032003, .
Source: U.S. Bureau of Labor Statistics
Release: Metropolitan Area Employment and Unemployment
Units:
Frequency:
Suggested Citation:
U.S. Bureau of Labor Statistics, Unemployment Rate in Las Vegas-Henderson-Paradise, NV (MSA) [LASV832URN], retrieved from FRED, Federal Reserve Bank of St. Louis; https://fred.stlouisfed.org/series/LASV832URN, .
Source: U.S. Census Bureau
Release: Housing Units Authorized By Building Permits
Units:
Frequency:
Notes:
This series represents the total number of building permits for all structure types. Structure types include 1-unit, 2-unit, 3-unit, 4-unit, and 5-unit or more.
The Saint Louis Federal Reserve Bank uses the most recent Metropolitan Statistical Area definitions released by the Office of Management and Budget. For more information on specific definitions visit here.
Suggested Citation:
U.S. Census Bureau, New Private Housing Structures Authorized by Building Permits for Las Vegas-Henderson-Paradise, NV (MSA) [LASV832BPPRIV], retrieved from FRED, Federal Reserve Bank of St. Louis; https://fred.stlouisfed.org/series/LASV832BPPRIV, .
Source: Federal Financial Institutions Examination Council (US)
Source: Federal Reserve Bank of St. Louis
Release: Reports of Condition and Income for All Insured U.S. Commercial Banks
Units:
Frequency:
Notes:
This series is discontinued and will no longer be updated. Additional consolidated data is available on the FDIC's Bank Data and Statistics.
This series represents Allowance for Loan and Lease Losses call item RCFD3123.
The asset class is determined by using Total Assets call item RCFD2170 less than or equal to $5B. Geographic location is determined by Abbreviated State Name call item RSSD9200 and County Code call item RSSD9150, which is mapped to the proper Core Based Statistical Area (CBSA) defined by the Office of Management and Budget (OMB).
Users are advised to use the Federal Reserve Board of Governors' data dictionary to retrieve detailed information for specific call items.
This series is calculated by the Federal Reserve Bank of St. Louis using raw data that are collected by the FFIEC. Raw data can be found at https://cdr.ffiec.gov/public/.
Suggested Citation:
Federal Financial Institutions Examination Council (US) and Federal Reserve Bank of St. Louis, Allowance for Loan and Lease Losses for Commercial Banks with Assets under $5B in Las Vegas-Henderson-Paradise, NV (MSA) (DISCONTINUED) [LLSLSV], retrieved from FRED, Federal Reserve Bank of St. Louis; https://fred.stlouisfed.org/series/LLSLSV, .
Source: Federal Reserve Bank of St. Louis
Release: Metro Area Economic Conditions Indexes
Units:
Frequency:
Notes:
The economic activity index measures average economic growth in the metropolitan area. It is computed using a dynamic factor model that includes 12 variables measuring various aspects of economic activity in the MSA. The index is calibrated to Gross Metropolitan Product (GMP) growth and variance to allow for comparison across metro areas.
For additional details, see Arias, M.A., C.S. Gascon and D.E. Rapach (2016), “Metro Business Cycles,” Journal of Urban Economics 94, 90-108, http://www.sciencedirect.com/science/article/pii/S009411901630016X.
Federal Reserve Bank of St. Louis Working Paper 2014-046C, https://research.stlouisfed.org/wp/more/2014-046.
Suggested Citation:
Federal Reserve Bank of St. Louis, Economic Conditions Index for Las Vegas-Henderson-Paradise, NV (MSA) (DISCONTINUED) [LSVAGRIDX], retrieved from FRED, Federal Reserve Bank of St. Louis; https://fred.stlouisfed.org/series/LSVAGRIDX, .
Source: U.S. Bureau of Economic Analysis
Release: Personal Income by County and Metropolitan Area
Units:
Frequency:
Suggested Citation:
U.S. Bureau of Economic Analysis, Per Capita Personal Income in Las Vegas-Henderson-Paradise, NV (MSA) [LASV832PCPI], retrieved from FRED, Federal Reserve Bank of St. Louis; https://fred.stlouisfed.org/series/LASV832PCPI, .
Source: U.S. Bureau of Labor Statistics
Source: Federal Reserve Bank of St. Louis
Release: Quarterly Census of Employment and Wages
Units:
Frequency:
Notes:
Total wages are the wages paid by Unemployment Insurance covered employers during the calendar quarter, regardless of when the services were performed. Included in wages are pay for vacation and other paid leave, bonuses, stock options, tips, the cash value of meals and lodging, and in some States, contributions to deferred compensation plans (such as 401(k) plans). The data were retrieved from the BLS API on the "Updated" date referenced above the graph. BLS.gov cannot vouch for the data or analyses derived from these data after the data have been retrieved from BLS.gov. "
Suggested Citation:
U.S. Bureau of Labor Statistics and Federal Reserve Bank of St. Louis, Total Quarterly Wages in Las Vegas-Henderson-Paradise, NV (MSA) [ENUC298230010], retrieved from FRED, Federal Reserve Bank of St. Louis; https://fred.stlouisfed.org/series/ENUC298230010, .
Release Tables
Equifax Credit Quality
Metro Area Economic Conditions Indexes
Metropolitan Area Employment and Unemployment
Minimum Wage Rate by State
Personal Income by County and Metropolitan Area
Personal Income by County and Metropolitan Area
Residential Vacancies and Homeownership Annual Statistics
Related Data and Content
Data Suggestions Based On Your Search


Content Suggestions


Other Formats
Unemployment Rate in Las Vegas-Henderson-Paradise, NV (MSA)
Annual, Not Seasonally Adjusted Monthly, Smoothed Seasonally AdjustedNew Private Housing Structures Authorized by Building Permits for Las Vegas-Henderson-Paradise, NV (MSA)
Monthly, Seasonally AdjustedTotal Quarterly Wages in Las Vegas-Henderson-Paradise, NV (MSA)
Quarterly, Seasonally AdjustedRelated Categories
Las Vegas-Henderson-Paradise, NV
MSAs
Nevada
States
U.S. Regional Data
Minimum Wage
Population, Employment, & Labor Markets
Clark County, NV
Counties
Releases
More
Series from Annual Estimates of the Population of Metropolitan and Micropolitan Statistical Areas
More
Series from Gross Domestic Product by County and Metropolitan Area
More
Series from Minimum Wage Rate by State
More
Series from Residential Vacancies and Homeownership Annual Statistics
More
Series from Equifax Credit Quality
More
Series from Metropolitan Area Employment and Unemployment
More
Series from Housing Units Authorized By Building Permits
More
Series from Reports of Condition and Income for All Insured U.S. Commercial Banks
More
Series from Metro Area Economic Conditions Indexes
More
Series from Personal Income by County and Metropolitan Area
More
Series from Quarterly Census of Employment and Wages
Tags
Las Vegas
Nevada
Residents
Population
Metropolitan Statistical Area
Census
Annual
Public Domain: Citation Requested
United States of America
Not Seasonally Adjusted
Industry
Bureau of Economic Analysis
Gross Domestic Product
Department of Labor
Minimum Wage
Wages
State
Rate
Vacancy
Rent
Clark County, NV
Equifax
Subprime
New York Fed
Copyrighted: Pre-Approval Required
Quarterly
County or County Equivalent
Unemployment
Bureau of Labor Statistics
Monthly
Permits
Buildings
New
Housing
Private
Allowance for Loan and Lease Losses
Under $5B
Federal Financial Institutions Examination Council
Reports of Condition and Income for All Insured U.S. Commercial Banks
Commercial
Assets
Banks
Discontinued
Depository Institutions
St. Louis Fed
Academic Data
Indexes
Seasonally Adjusted
Copyrighted: Citation Required
Personal Income
Per Capita
Personal
Income
Quarterly Census of Employment & Wages