FRED Graph
Notes
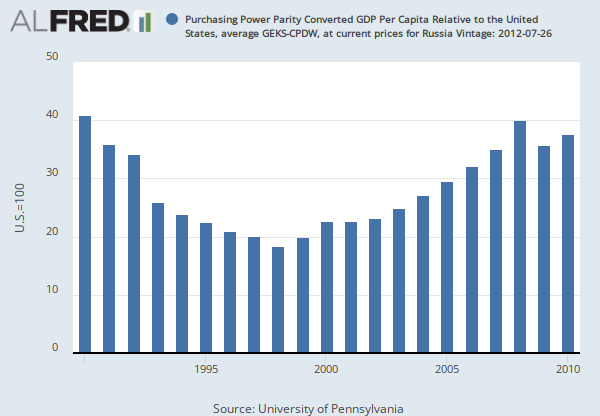
Source: University of Pennsylvania
Release: Penn World Table 7.1
Units:
Frequency:
Notes:
This data series refers to China Version 2. Two estimates are provided for China and their rationale is discussed in the Detailed Documentation. One estimate is based mostly on ICP 2005 and national growth statistics and is labeled China1. China1 does incorporate a productivity adjustment that has been applied to all countries in ICP 2005. China2 also adjusts for the urban character of its prices in ICP 2005 and also adjusts the growth rate.
This is the current per capita GDP expressed relative to the United State (US=100) in each year.
For more information and proper citation see http://www.rug.nl/research/ggdc/data/pwt/pwt-7.1
Source Indicator: y2
Suggested Citation:
University of Pennsylvania, Purchasing Power Parity Converted GDP Per Capita Relative to the United States, average GEKS-CPDW, at current prices for China [PGD2U2CNA621NUPN], retrieved from FRED, Federal Reserve Bank of St. Louis; https://fred.stlouisfed.org/series/PGD2U2CNA621NUPN, March 13, 2025.
Source: University of Pennsylvania
Release: Penn World Table 7.1
Units:
Frequency:
Notes:
This is the current per capita GDP expressed relative to the United State (US=100) in each year.
For more information and proper citation see http://www.rug.nl/research/ggdc/data/pwt/pwt-7.1
Source Indicator: y2
Suggested Citation:
University of Pennsylvania, Purchasing Power Parity Converted GDP Per Capita Relative to the United States, average GEKS-CPDW, at current prices for Brazil [PGD2USBRA621NUPN], retrieved from FRED, Federal Reserve Bank of St. Louis; https://fred.stlouisfed.org/series/PGD2USBRA621NUPN, March 13, 2025.
Source: University of Pennsylvania
Release: Penn World Table 7.1
Units:
Frequency:
Notes:
This is the current per capita GDP expressed relative to the United State (US=100) in each year.
For more information and proper citation see http://www.rug.nl/research/ggdc/data/pwt/pwt-7.1
Source Indicator: y2
Suggested Citation:
University of Pennsylvania, Purchasing Power Parity Converted GDP Per Capita Relative to the United States, average GEKS-CPDW, at current prices for India [PGD2USINA621NUPN], retrieved from FRED, Federal Reserve Bank of St. Louis; https://fred.stlouisfed.org/series/PGD2USINA621NUPN, March 13, 2025.
Source: University of Pennsylvania
Release: Penn World Table 7.1
Units:
Frequency:
Notes:
This is the current per capita GDP expressed relative to the United State (US=100) in each year.
For more information and proper citation see http://www.rug.nl/research/ggdc/data/pwt/pwt-7.1
Source Indicator: y2
Suggested Citation:
University of Pennsylvania, Purchasing Power Parity Converted GDP Per Capita Relative to the United States, average GEKS-CPDW, at current prices for United Kingdom [PGD2USGBA621NUPN], retrieved from FRED, Federal Reserve Bank of St. Louis; https://fred.stlouisfed.org/series/PGD2USGBA621NUPN, March 13, 2025.
Source: University of Pennsylvania
Release: Penn World Table 7.1
Units:
Frequency:
Notes:
This is the current per capita GDP expressed relative to the United State (US=100) in each year.
For more information and proper citation see http://www.rug.nl/research/ggdc/data/pwt/pwt-7.1
Source Indicator: y2
Suggested Citation:
University of Pennsylvania, Purchasing Power Parity Converted GDP Per Capita Relative to the United States, average GEKS-CPDW, at current prices for France [PGD2USFRA621NUPN], retrieved from FRED, Federal Reserve Bank of St. Louis; https://fred.stlouisfed.org/series/PGD2USFRA621NUPN, March 13, 2025.
Source: University of Pennsylvania
Release: Penn World Table 7.1
Units:
Frequency:
Notes:
This is the current per capita GDP expressed relative to the United State (US=100) in each year.
For more information and proper citation see http://www.rug.nl/research/ggdc/data/pwt/pwt-7.1
Source Indicator: y2
Suggested Citation:
University of Pennsylvania, Purchasing Power Parity Converted GDP Per Capita Relative to the United States, average GEKS-CPDW, at current prices for Greece [PGD2USGRA621NUPN], retrieved from FRED, Federal Reserve Bank of St. Louis; https://fred.stlouisfed.org/series/PGD2USGRA621NUPN, March 13, 2025.
Source: University of Pennsylvania
Release: Penn World Table 7.1
Units:
Frequency:
Notes:
This is the current per capita GDP expressed relative to the United State (US=100) in each year.
For more information and proper citation see http://www.rug.nl/research/ggdc/data/pwt/pwt-7.1
Source Indicator: y2
Suggested Citation:
University of Pennsylvania, Purchasing Power Parity Converted GDP Per Capita Relative to the United States, average GEKS-CPDW, at current prices for Russia [PGD2USRUA621NUPN], retrieved from FRED, Federal Reserve Bank of St. Louis; https://fred.stlouisfed.org/series/PGD2USRUA621NUPN, March 13, 2025.
Source: University of Pennsylvania
Release: Penn World Table 7.1
Units:
Frequency:
Notes:
This is the current per capita GDP expressed relative to the United State (US=100) in each year.
For more information and proper citation see http://www.rug.nl/research/ggdc/data/pwt/pwt-7.1
Source Indicator: y2
Suggested Citation:
University of Pennsylvania, Purchasing Power Parity Converted GDP Per Capita Relative to the United States, average GEKS-CPDW, at current prices for South Africa [PGD2USZAA621NUPN], retrieved from FRED, Federal Reserve Bank of St. Louis; https://fred.stlouisfed.org/series/PGD2USZAA621NUPN, March 13, 2025.
Source: University of Pennsylvania
Release: Penn World Table 7.1
Units:
Frequency:
Notes:
This is the current per capita GDP expressed relative to the United State (US=100) in each year.
For more information and proper citation see http://www.rug.nl/research/ggdc/data/pwt/pwt-7.1
Source Indicator: y2
Suggested Citation:
University of Pennsylvania, Purchasing Power Parity Converted GDP Per Capita Relative to the United States, average GEKS-CPDW, at current prices for Germany [PGD2USDEA621NUPN], retrieved from FRED, Federal Reserve Bank of St. Louis; https://fred.stlouisfed.org/series/PGD2USDEA621NUPN, March 13, 2025.