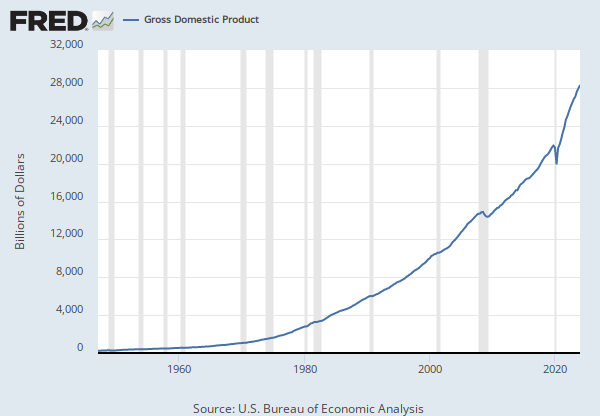
All Sectors; Gross Value Added (IMA), Transactions (ALSGVAA027N)

2025: 30,532,476
Updated: Jun 11, 2026 6:41 PM CDT
2025:  30,532,476  
2024:  29,001,717  
2023:  27,485,662  
2022:  26,055,015  
2021:  23,687,814  
View All

Units:

Millions of U.S. Dollars,
Seasonally Adjusted Annual Rate

Frequency:

Annual,
End of Period

Fullscreen

Notes

Source: Board of Governors of the Federal Reserve System (US)  

Release: Z.1 Financial Accounts of the United States  

Units:  Millions of U.S. Dollars, Seasonally Adjusted Annual Rate

Frequency:  Annual, End of Period

Notes:

For more information about the Flow of Funds tables, see the Financial Accounts Guide.##With each quarterly release, the source may make major data and structural revisions to the series and tables. These changes are available in the Release Highlights.##In the Financial Accounts, the source identifies each series by a string of patterned letters and numbers. For a detailed description, including how this series is constructed, see the series analyzer provided by the source.

Suggested Citation:

Board of Governors of the Federal Reserve System (US), All Sectors; Gross Value Added (IMA), Transactions [ALSGVAA027N], retrieved from FRED, Federal Reserve Bank of St. Louis; https://fred.stlouisfed.org/series/ALSGVAA027N, .


Back to Top