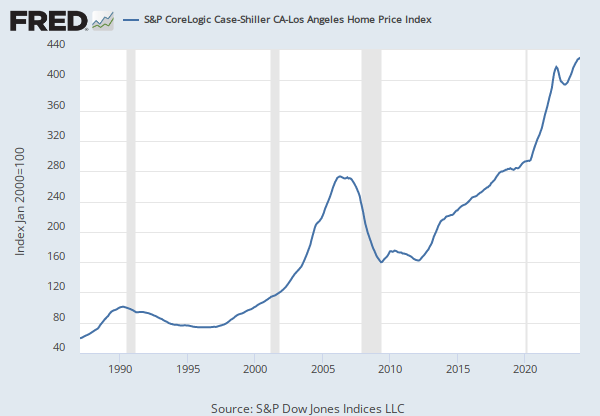
Categories > U.S. Regional Data > States > Idaho > MSAs > Idaho Falls, ID
Observation:
Q4 2022: 402.44 (+ more) Updated: Feb 28, 2023Q4 2022: | 402.44 | |
Q3 2022: | 420.01 | |
Q2 2022: | 426.28 | |
Q1 2022: | 398.68 | |
Q4 2021: | 376.51 | |
View All |
Units:
Index 1995:Q1=100,Frequency:
QuarterlyData in this graph are copyrighted. Please review the copyright information in the series notes before sharing.
Source: U.S. Federal Housing Finance Agency
Release: House Price Index
Units: Index 1995:Q1=100, Not Seasonally Adjusted
Frequency: Quarterly
Estimated using sales prices and appraisal data.
U.S. Federal Housing Finance Agency, All-Transactions House Price Index for Idaho Falls, ID (MSA) [ATNHPIUS26820Q], retrieved from FRED, Federal Reserve Bank of St. Louis; https://fred.stlouisfed.org/series/ATNHPIUS26820Q, March 31, 2023.