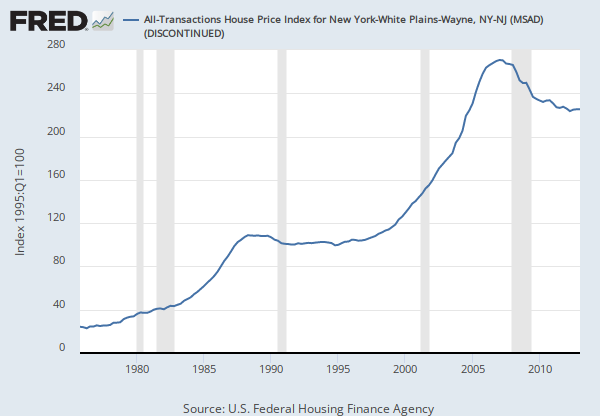
Explore resources provided by the Research Division at the Federal Reserve Bank of St. Louis.
Categories > U.S. Regional Data > States > New Jersey > Metropolitan Divisions > New York-Jersey City-White Plains, NY-NJ
Observation:
Q4 2021: 334.56 (+ more)Q4 2021: | 334.56 | |
Q3 2021: | 327.32 | |
Q2 2021: | 314.30 | |
Q1 2021: | 306.03 | |
Q4 2020: | 300.54 | |
View All |
Units:
Index 1995:Q1=100,Frequency:
QuarterlyData in this graph are copyrighted. Please review the copyright information in the series notes before sharing.
Source: U.S. Federal Housing Finance Agency
Release: House Price Index
Units: Index 1995:Q1=100, Not Seasonally Adjusted
Frequency: Quarterly
Estimated using sales prices and appraisal data.
U.S. Federal Housing Finance Agency, All-Transactions House Price Index for New York-Jersey City-White Plains, NY-NJ (MSAD) [ATNHPIUS35614Q], retrieved from FRED, Federal Reserve Bank of St. Louis; https://fred.stlouisfed.org/series/ATNHPIUS35614Q, May 21, 2022.
Are you sure you want to remove this series from the graph? This can not be undone.