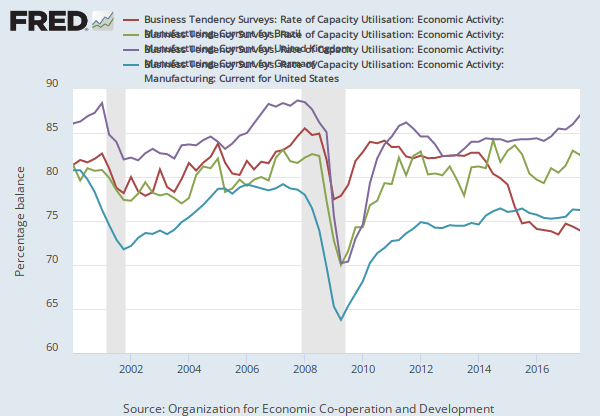
Categories > International Data > Countries > United Kingdom
Observation:
Q1 2021: 74.9 (+ more) Updated: Feb 17, 2021Q1 2021: | 74.9 | |
Q4 2020: | 70.5 | |
Q3 2020: | 63.8 | |
Q2 2020: | 57.7 | |
Q1 2020: | 79.6 | |
View All |
Units:
Percent,Frequency:
QuarterlyData in this graph are copyrighted. Please review the copyright information in the series notes before sharing.
Source: Organization for Economic Co-operation and Development
Release: Main Economic Indicators
Units: Percent, Seasonally Adjusted
Frequency: Quarterly
OECD descriptor ID: BSCURT02
OECD unit ID: STSA
OECD country ID: GBR
All OECD data should be cited as follows: OECD, "Main Economic Indicators - complete database", Main Economic Indicators (database),http://dx.doi.org/10.1787/data-00052-en (Accessed on date)
Copyright, 2016, OECD. Reprinted with permission.
Organization for Economic Co-operation and Development, Business Tendency Surveys for Manufacturing: Capacity Utilization: Rate of Capacity Utilization: European Commission and National Indicators for the United Kingdom [BSCURT02GBQ160S], retrieved from FRED, Federal Reserve Bank of St. Louis; https://fred.stlouisfed.org/series/BSCURT02GBQ160S, March 21, 2023.