Source:
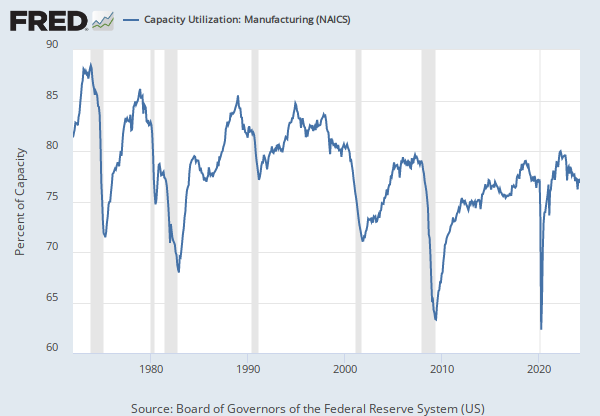
Board of Governors of the Federal Reserve System (US)
Release:
G.17 Industrial Production and Capacity Utilization
Units:
Percent, Seasonally Adjusted
Frequency:
Annual
Notes:
The Federal Reserve Board constructs estimates of capacity and capacity utilization for industries in manufacturing, mining, and electric and gas utilities. For a given industry, the capacity utilization rate is equal to an output index (seasonally adjusted) divided by a capacity index. The Federal Reserve Board's capacity indexes attempt to capture the concept of sustainable maximum output -- the greatest level of output a plant can maintain within the framework of a realistic work schedule, after factoring in normal downtime and assuming sufficient availability of inputs to operate the capital in place.
The Federal Reserve's monthly index of industrial production and the related capacity indexes and capacity utilization rates cover manufacturing, mining, and electric and gas utilities. The industrial sector, together with construction, accounts for the bulk of the variation in national output over the course of the business cycle. The industrial detail provided by these measures helps illuminate structural developments in the economy. The industrial production (IP) index measures the real output of all relevant establishments located in the United States, regardless of their ownership, but not those located in U.S. territories. For more information, see the explanatory notes issued by the Board of Governors. For recent updates, see the announcements issued by the Board of Governors.
Suggested Citation:
Board of Governors of the Federal Reserve System (US),
Capacity Utilization: Utilities: Electric and Gas Utilities (NAICS = 2211,2) [CAPUTLG2211A2A],
retrieved from FRED,
Federal Reserve Bank of St. Louis;
https://fred.stlouisfed.org/series/CAPUTLG2211A2A,
.