
Federal Reserve Economic Data: Your trusted data source since 1991
Your trusted data source
since 1991.
NOTES
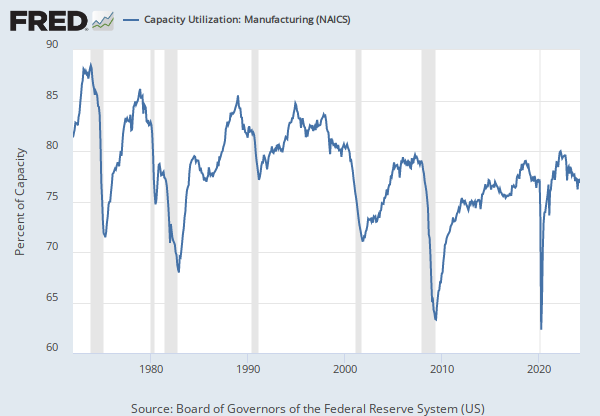
Source: Board of Governors of the Federal Reserve System (US)
Release: G.17 Industrial Production and Capacity Utilization
Units:
Frequency:
Notes:
For a given industry, the capacity utilization rate is equal to an output index divided by a capacity index. The Federal Reserve Board's capacity indexes attempt to capture the concept of sustainable maximum output-the greatest level of output a plant can maintain within the framework of a realistic work schedule, after factoring in normal downtime and assuming sufficient availability of inputs to operate the capital in place.
For more information, see the explanatory notes issued by the Board of Governors. For recent updates, see the announcements issued by the Board of Governors
Source Code: CAPUTL.GMFN.S
Suggested Citation:
Board of Governors of the Federal Reserve System (US), Capacity Utilization: Nondurable Manufacturing (NAICS) [CAPUTLGMFNS], retrieved from FRED, Federal Reserve Bank of St. Louis; https://fred.stlouisfed.org/series/CAPUTLGMFNS, .
RELEASE TABLES
G.17 Industrial Production and Capacity Utilization
RELATED DATA AND CONTENT
Data Suggestions Based On Your Search


Content Suggestions


