Source:
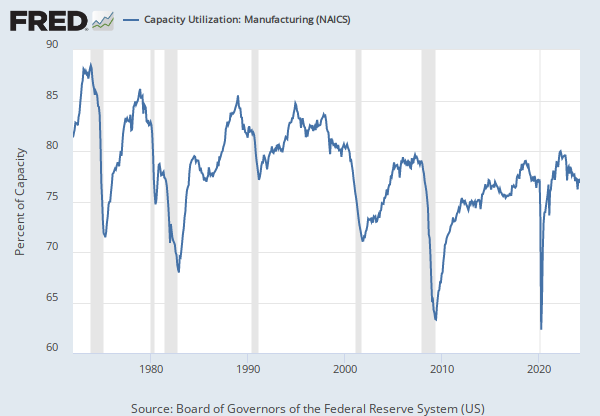
Board of Governors of the Federal Reserve System (US)
Release:
G.17 Industrial Production and Capacity Utilization
Units:
Index 2017=100, Not Seasonally Adjusted
Frequency:
Annual
Notes:
The Federal Reserve's monthly index of industrial production and the related capacity indexes and capacity utilization rates cover manufacturing, mining, and electric and gas utilities. The industrial sector, together with construction, accounts for the bulk of the variation in national output over the course of the business cycle. The industrial detail provided by these measures helps illuminate structural developments in the economy. The industrial production (IP) index measures the real output of all relevant establishments located in the United States, regardless of their ownership, but not those located in U.S. territories. For more information, see the explanatory notes issued by the Board of Governors. For recent updates, see the announcements issued by the Board of Governors.
Suggested Citation:
Board of Governors of the Federal Reserve System (US),
Industrial Production: Manufacturing: Nondurable Goods: Sugar and Confectionery Product (NAICS = 3113) [IPG3113A],
retrieved from FRED,
Federal Reserve Bank of St. Louis;
https://fred.stlouisfed.org/series/IPG3113A,
.