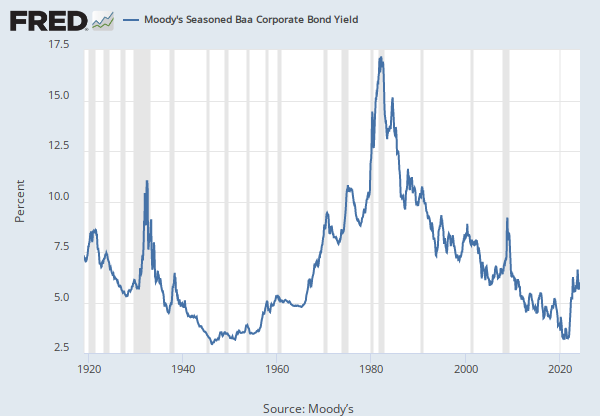
Federal Reserve Economic Data: Your trusted data source since 1991

Index of Yields of High Grade Public Utility Bonds for United States (M13025USM156NNBR)

Observation:

Dec 1963: 4.39 (+ more)   Updated: Aug 20, 2012 8:17 AM CDT
Dec 1963:  4.39  
Nov 1963:  4.35  
Oct 1963:  4.34  
Sep 1963:  4.34  
Aug 1963:  4.30  
View All

Units:

Percent,
Not Seasonally Adjusted

Frequency:

Monthly

NOTES

Source: National Bureau of Economic Research  

Release: NBER Macrohistory Database  

Units:  Percent, Not Seasonally Adjusted

Frequency:  Monthly

Notes:

Data For 1900-1928 Are Based Upon The Mean Of The Monthly High And Low Price Of Five High Grade Bonds. Data For 1929-1937 Are Based Upon A Varying Group Of A1+ Bonds, One Price Monthly Being Used. Data Beginning April 1937 Are Based On The Average Of The Four Or Five Weekly A1+ Indexes. The Yield To Maturity Has Been Used. Missing Data For August-October 1914 Is Due To The Stock Exchange Closing. Source: Standard And Poor'S, Data For 1900-1946: "Long Term Security Price Index Record (Through December 31, 1940)", P. 128;"Security Price Record: 1941 And 1943", P. 13;"Current Statistics Combined With Basic Statistics", 1944-1946. Data For 1947: "Statistics: Security Price Index Record", 1948 Edition, P. 134. Data For 1948-1950: "Current Statistics Combined With Basic Statistics", January Issues Of 1949-1950. Data For 1951-1963: "Current Statistics", February 1952 And Successive Issues.

This NBER data series m13025 appears on the NBER website in Chapter 13 at http://www.nber.org/databases/macrohistory/contents/chapter13.html.

NBER Indicator: m13025

Suggested Citation:

National Bureau of Economic Research, Index of Yields of High Grade Public Utility Bonds for United States [M13025USM156NNBR], retrieved from FRED, Federal Reserve Bank of St. Louis; https://fred.stlouisfed.org/series/M13025USM156NNBR, May 15, 2024.

RELEASE TABLES


Subscribe to the FRED newsletter


Follow us

Back to Top
Top