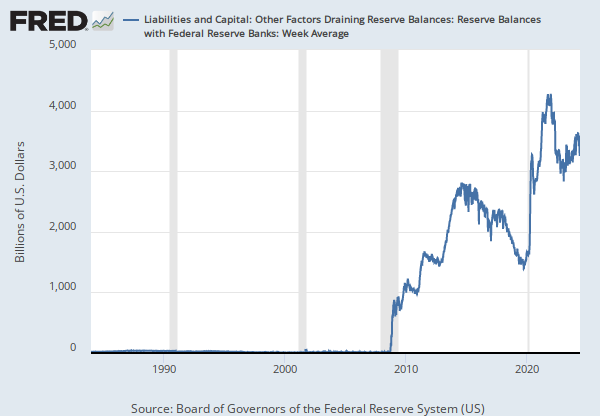
Categories > Money, Banking, & Finance > Monetary Data > Reserves
Observation:
May 2013: 1,862.936 (+ more)May 2013: | 1,862.936 | |
Apr 2013: | 1,768.434 | |
Mar 2013: | 1,697.760 | |
Feb 2013: | 1,616.323 | |
Jan 2013: | 1,518.894 | |
View All |
Units:
Billions of Dollars,Frequency:
MonthlyData in this graph are copyrighted. Please review the copyright information in the series notes before sharing.
Source: Board of Governors of the Federal Reserve System (US)
Release: H.3 Aggregate Reserves of Depository Institutions and the Monetary Base
Units: Billions of Dollars, Not Seasonally Adjusted
Frequency: Monthly
The series is calculated by the Federal Reserve Bank of St.Louis.
Prior to 2003-01-01, the data are calculated as excess reserves minus total borrowings plus extended borrowings. From 2003-01-01 till 2007-11-01, the observations reflect excess reserves minus total borrowings plus secondary borrowings. From 2007-12-01, the definition changes to excess reserves minus discount window borrowings plus secondary borrowings. Please, check the latest definition of the discount window borrowings at https://fred.stlouisfed.org/series/DISCBORR.
This series has been discontinued with a phase of the simplification of reserves administration (https://federalregister.gov/a/2012-8562).
Board of Governors of the Federal Reserve System (US), Net Free or Borrowed Reserves of Depository Institutions (DISCONTINUED) [NFORBRES], retrieved from FRED, Federal Reserve Bank of St. Louis; https://fred.stlouisfed.org/series/NFORBRES, February 17, 2019.
Are you sure you want to remove this series from the graph? This can not be undone.
Send Us Feedback
We will reply as soon as possible. If you have not received a response within two business days, please send your inquiry again or call (314) 444-3733.