Source:
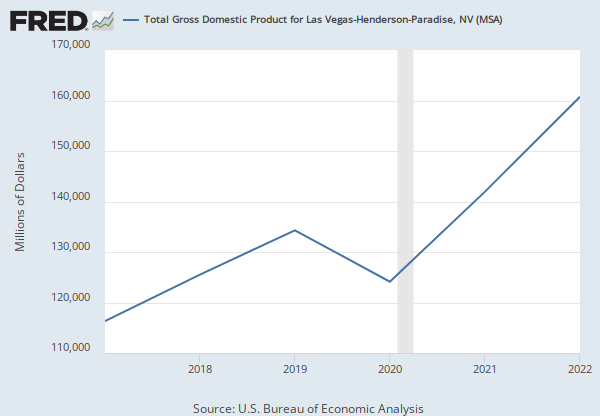
U.S. Bureau of Economic Analysis
Release:
Gross Domestic Product by County
Units:
Index 2017=100, Not Seasonally Adjusted
Frequency:
Annual
Notes:
The All industry total includes all Private industries and Government.
A chained-type index is based on the linking (chaining) of indexes to create a time series. Annual chained-type Fisher indices are used in BEA's national income and product accounts (NIPAs) whereby Fisher ideal price indices are calculated using the weights of adjacent years. Those annual changes are then multiplied (chained) together, forming the chained-type index time series. Chain-type indexes or chain-dollar estimates are used when you want to show how output or spending has changed over time. The percent changes in quantity indexes exactly match the percent changes in chained dollars, so they can be used interchangeably for making comparisons. Real estimates remove the effects of price changes, which can obscure changes in output or spending in current dollars.
For more information about this release go to http://www.bea.gov/newsreleases/regional/gdp_metro/gdp_metro_newsrelease.htm.
Suggested Citation:
U.S. Bureau of Economic Analysis,
Total Quantity Indexes for Real GDP for Las Vegas-Henderson-Paradise, NV (MSA) (DISCONTINUED) [QGMP29820],
retrieved from FRED,
Federal Reserve Bank of St. Louis;
https://fred.stlouisfed.org/series/QGMP29820,
.