Source:
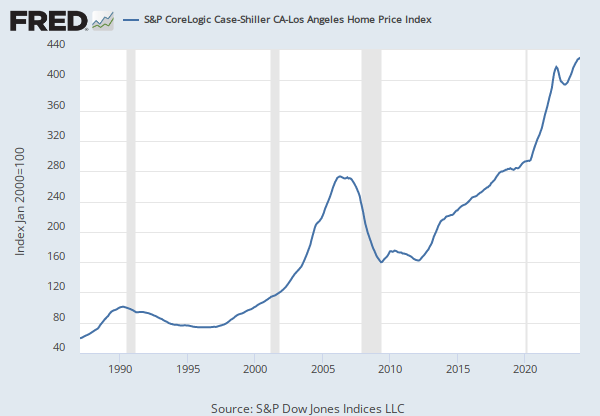
S&P Dow Jones Indices LLC
Release:
S&P Cotality Case-Shiller Home Price Indices
Units:
Index Jan 2000=100, Seasonally Adjusted
Frequency:
Monthly
Notes:
For more information regarding the index, please visit Standard & Poor's.
Copyright © 2016, S&P Dow Jones Indices LLC. All rights reserved. Reproduction of Home Price Index for San Francisco, California in any form is prohibited except with the prior written permission of S&P Dow Jones Indices LLC "S&P". S&P does not guarantee the accuracy, adequacy, completeness or availability of any information and is not responsible for any errors or omissions, regardless of the cause or for the results obtained from the use of such information. S&P DISCLAIMS ANY AND ALL EXPRESS OR IMPLIED WARRANTIES, INCLUDING, BUT NOT LIMITED TO, ANY WARRANTIES OF MERCHANTABILITY OR FITNESS FOR A PARTICULAR PURPOSE OR USE. In no event shall S&P be liable for any direct, indirect, special or consequential damages, costs, expenses, legal fees, or losses (including lost income or lost profit and opportunity costs) in connection with subscriber's or others' user of Home Price Index for San Francisco, California.
Permission to reproduce this series can be requested from index_services@spdji.com. More contact details are available, including phone numbers for all regional offices.
Suggested Citation:
S&P Dow Jones Indices LLC,
S&P Cotality Case-Shiller CA-San Francisco Home Price Index [SFXRSA],
retrieved from FRED,
Federal Reserve Bank of St. Louis;
https://fred.stlouisfed.org/series/SFXRSA,
.