Federal Reserve Economic Data
Data in this graph are copyrighted. Please review the copyright information in the series notes before sharing.
Notes
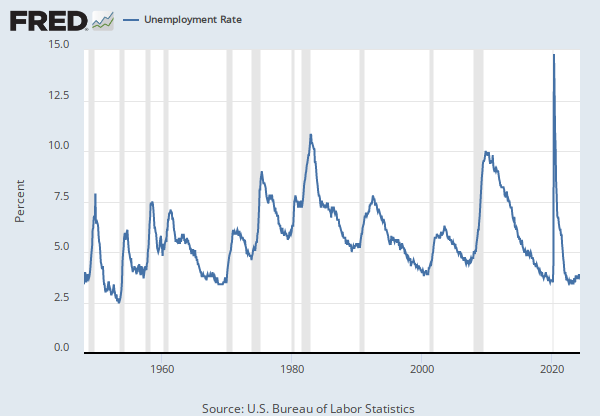
Source: U.S. Bureau of Labor Statistics
Release: Employment Situation
Units: Percent, Not Seasonally Adjusted
Frequency: Monthly
Notes:
The series comes from the 'Current Population Survey (Household Survey)'
The source code is: LNU03327709
Suggested Citation:
U.S. Bureau of Labor Statistics, Total Unemployed, Plus All Persons Marginally Attached to the Labor Force, Plus Total Employed Part Time for Economic Reasons, as a Percent of the Civilian Labor Force Plus All Persons Marginally Attached to the Labor Force (U-6) [U6RATENSA], retrieved from FRED, Federal Reserve Bank of St. Louis; https://fred.stlouisfed.org/series/U6RATENSA, .
Release Tables
Permalink/Embed
modal open, choose link customization options
Select automatic updates to the data or a static time frame. All data are subject to revision.


