Federal Reserve Economic Data
Notes
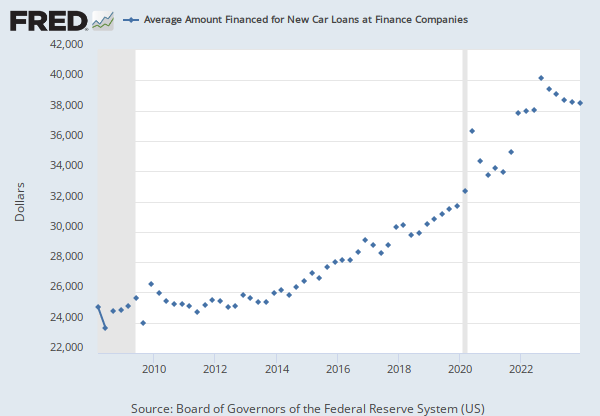
Source: Board of Governors of the Federal Reserve System (US)
Release: G.19 Consumer Credit
Units:
Frequency:
Notes:
For questions on the data, please contact the data source. For questions on FRED functionality, please contact us here.
Suggested Citation:
Board of Governors of the Federal Reserve System (US), Student Loans Owned and Securitized (DISCONTINUED) [SLOAS], retrieved from FRED, Federal Reserve Bank of St. Louis; https://fred.stlouisfed.org/series/SLOAS, .
Source: U.S. Bureau of Labor Statistics
Release: Consumer Price Index
Units:
Frequency:
Notes:
The Consumer Price Index for All Urban Consumers: All Items (CPIAUCSL) is a price index of a basket of goods and services paid by urban consumers. Percent changes in the price index measure the inflation rate between any two time periods. The most common inflation metric is the percent change from one year ago. It can also represent the buying habits of urban consumers. This particular index includes roughly 88 percent of the total population, accounting for wage earners, clerical workers, technical workers, self-employed, short-term workers, unemployed, retirees, and those not in the labor force.
The CPIs are based on prices for food, clothing, shelter, and fuels; transportation fares; service fees (e.g., water and sewer service); and sales taxes. Prices are collected monthly from about 4,000 housing units and approximately 26,000 retail establishments across 87 urban areas. To calculate the index, price changes are averaged with weights representing their importance in the spending of the particular group. The index measures price changes (as a percent change) from a predetermined reference date. In addition to the original unadjusted index distributed, the Bureau of Labor Statistics also releases a seasonally adjusted index. The unadjusted series reflects all factors that may influence a change in prices. However, it can be very useful to look at the seasonally adjusted CPI, which removes the effects of seasonal changes, such as weather, school year, production cycles, and holidays.
The CPI can be used to recognize periods of inflation and deflation. Significant increases in the CPI within a short time frame might indicate a period of inflation, and significant decreases in CPI within a short time frame might indicate a period of deflation. However, because the CPI includes volatile food and oil prices, it might not be a reliable measure of inflationary and deflationary periods. For a more accurate detection, the core CPI (CPILFESL) is often used. When using the CPI, please note that it is not applicable to all consumers and should not be used to determine relative living costs. Additionally, the CPI is a statistical measure vulnerable to sampling error since it is based on a sample of prices and not the complete average.
For more information on the CPI, see the Handbook of Methods, the release notes and announcements, and the Frequently Asked Questions (FAQs).
Suggested Citation:
U.S. Bureau of Labor Statistics, Consumer Price Index for All Urban Consumers: All Items in U.S. City Average [CPIAUCSL], retrieved from FRED, Federal Reserve Bank of St. Louis; https://fred.stlouisfed.org/series/CPIAUCSL, .
Source: Board of Governors of the Federal Reserve System (US)
Release: G.19 Consumer Credit
Units:
Frequency:
Notes:
For questions on the data, please contact the data source. For questions on FRED functionality, please contact us here.
Suggested Citation:
Board of Governors of the Federal Reserve System (US), Revolving Consumer Credit Owned and Securitized [REVOLSL], retrieved from FRED, Federal Reserve Bank of St. Louis; https://fred.stlouisfed.org/series/REVOLSL, .
Source: Board of Governors of the Federal Reserve System (US)
Release: G.19 Consumer Credit
Units:
Frequency:
Notes:
For questions on the data, please contact the data source. For questions on FRED functionality, please contact us here.
Suggested Citation:
Board of Governors of the Federal Reserve System (US), Motor Vehicle Loans Owned and Securitized (DISCONTINUED) [MVLOAS], retrieved from FRED, Federal Reserve Bank of St. Louis; https://fred.stlouisfed.org/series/MVLOAS, .
Source: U.S. Census Bureau
Release: Income and Poverty in the United States
Units:
Frequency:
Notes:
Household data are collected as of March.
As stated in the Census's "Source and Accuracy of Estimates for Income, Poverty, and Health Insurance Coverage in the United States: 2011" (http://www.census.gov/hhes/www/p60_243sa.pdf):
Estimation of Median Incomes. The Census Bureau has changed the methodology for computing median income over time. The Census Bureau has computed medians using either Pareto interpolation or linear interpolation. Currently, we are using linear interpolation to estimate all medians. Pareto interpolation assumes a decreasing density of population within an income interval, whereas linear interpolation assumes a constant density of population within an income interval. The Census Bureau calculated estimates of median income and associated standard errors for 1979 through 1987 using Pareto interpolation if the estimate was larger than $20,000 for people or $40,000 for families and households. This is because the width of the income interval containing the estimate is greater than $2,500.
We calculated estimates of median income and associated standard errors for 1976, 1977, and 1978 using Pareto interpolation if the estimate was larger than $12,000 for people or $18,000 for families and households. This is because the width of the income interval containing the estimate is greater than $1,000. All other estimates of median income and associated standard errors for 1976 through 2011 (2012 ASEC) and almost all of the estimates of median income and associated standard errors for 1975 and earlier were calculated using linear interpolation.
Thus, use caution when comparing median incomes above $12,000 for people or $18,000 for families and households for different years. Median incomes below those levels are more comparable from year to year since they have always been calculated using linear interpolation. For an indication of the comparability of medians calculated using Pareto interpolation with medians calculated using linear interpolation, see Series P-60, Number 114, Money Income in 1976 of Families and Persons in the United States (www2.census.gov/prod2/popscan/p60-114.pdf).
Suggested Citation:
U.S. Census Bureau, Median Household Income in the United States [MEHOINUSA646N], retrieved from FRED, Federal Reserve Bank of St. Louis; https://fred.stlouisfed.org/series/MEHOINUSA646N, .
Source: U.S. Bureau of Labor Statistics
Release: Employment Situation
Units:
Frequency:
Notes:
The series comes from the 'Current Employment Statistics (Establishment Survey).'
The source code is: CES0500000003
The Average Hourly Earnings of All Private Employees is a measure of the average hourly earnings of all private employees on a “gross” basis, including premium pay for overtime and late-shift work. These differ from wage rates in that average hourly earnings measure the actual return to a worker for a set period of time, rather than the amount contracted for a unit of work, the wage rate. This measure excludes benefits, irregular bonuses, retroactive pay, and payroll taxes paid by the employer.
Average Hourly Earnings are collected in the Current Employment Statistics (CES) program and published by the BLS. It is provided on a monthly basis, so this data is used in part by macroeconomists as an initial economic indicator of current trends. Progressions in earnings specifically help policy makers understand some of the pressures driving inflation.
It is important to note that this series measures the average hourly earnings of the pool of workers in each period. Thus, changes in average hourly earnings can be due to either changes in the set of workers observed in a given period, or due to changes in earnings. For instance, in recessions that lead to the disproportionate increase of unemployment in lower-wage jobs, average hourly earnings can increase due to changes in the pool of workers rather than due to the widespread increase of hourly earnings at the worker-level.
For more information, see:
U.S. Bureau of Labor Statistics, CES Overview
U.S. Bureau of Labor Statistics, BLS Handbook of Methods: Chapter 2. Employment, Hours, and Earnings from the Establishment Survey
Suggested Citation:
U.S. Bureau of Labor Statistics, Average Hourly Earnings of All Employees, Total Private [CES0500000003], retrieved from FRED, Federal Reserve Bank of St. Louis; https://fred.stlouisfed.org/series/CES0500000003, .
Release Tables
Consumer Price Index
Employment Situation
G.19 Consumer Credit
Income and Poverty in the United States
Related Data and Content
Data Suggestions Based On Your Search


Content Suggestions


Other Formats
Consumer Price Index for All Urban Consumers: All Items in U.S. City Average
Monthly, Not Seasonally Adjusted Semiannual, Not Seasonally AdjustedRevolving Consumer Credit Owned and Securitized
Monthly, Not Seasonally AdjustedAverage Hourly Earnings of All Employees, Total Private
Monthly, Not Seasonally AdjustedRelated Categories
Consumer Credit
Banking
Money, Banking, & Finance
Consumer Price Indexes (CPI and PCE)
Prices
Income Distribution
Population, Employment, & Labor Markets
Total Private
Current Employment Statistics (Establishment Survey)
Releases
More
Series from G.19 Consumer Credit
More
Series from Consumer Price Index
More
Series from Income and Poverty in the United States
More
Series from Employment Situation
Tags
Student
Securitized
Owned
G.19 Consumer Credit
Loans
Discontinued
Board of Governors
Quarterly
Nation
Public Domain: Citation Requested
United States of America
Not Seasonally Adjusted
Headline Figure
All Items
Average
Urban
Consumer
Consumer Price Index
Inflation
Price Index
Indexes
Price
Seasonally Adjusted
Bureau of Labor Statistics
Monthly
Revolving
Consumer Credit
Vehicles
Households
Income
Median
Census
Annual
Current Employment Statistics Survey (Establishment Survey)
Earnings
Hours
Wages
Private
Employment