Federal Reserve Economic Data
Notes
Source: Board of Governors of the Federal Reserve System (US)
Release: H.15 Selected Interest Rates
Units:
Frequency:
Notes:
Averages of daily figures.
For additional historical federal funds rate data, please see Daily Federal Funds Rate from 1928-1954.
The federal funds rate is the interest rate at which depository institutions trade federal funds (balances held at Federal Reserve Banks) with each other overnight. When a depository institution has surplus balances in its reserve account, it lends to other banks in need of larger balances. In simpler terms, a bank with excess cash, which is often referred to as liquidity, will lend to another bank that needs to quickly raise liquidity. (1) The rate that the borrowing institution pays to the lending institution is determined between the two banks; the weighted average rate for all of these types of negotiations is called the effective federal funds rate.(2) The effective federal funds rate is essentially determined by the market but is influenced by the Federal Reserve as it uses the Interest on Reserve Balances rate to steer the federal funds rate toward the target range.(2)
The Federal Open Market Committee (FOMC) meets eight times a year to determine the federal funds target range. The Fed's primary tool for influencing the federal funds rate is the interest the Fed pays on the funds that banks hold as reserve balances at their Federal Reserve Bank, which is the Interest on Reserves Balances (IORB) rate. Because banks are unlikely to lend funds in the federal funds market for less than they get paid in their reserve balance account at the Federal Reserve, the Interest on Reserve Balances (IORB) is an effective tool for guiding the federal funds rate. (3) Whether the Federal Reserve raises or lowers the target range for the federal funds rate depends on the state of the economy. If the FOMC believes the economy is growing too fast and inflation pressures are inconsistent with the dual mandate of the Federal Reserve, the Committee may temper economic activity by raising the target range for federal funds rate, and increasing the IORB rate to steer the federal funds rate into the target range. In the opposing scenario, the FOMC may spur greater economic activity by lowering the target range for federal funds rate, and decreasing the IORB rate to steer the federal funds rate into the target range. (3) Therefore, the FOMC must observe the current state of the economy to determine the best course of monetary policy that will maximize economic growth while adhering to the dual mandate set forth by Congress. In making its monetary policy decisions, the FOMC considers a wealth of economic data, such as: trends in prices and wages, employment, consumer spending and income, business investments, and foreign exchange markets.
The federal funds rate is the central interest rate in the U.S. financial market. It influences other interest rates such as the prime rate, which is the rate banks charge their customers with higher credit ratings. Additionally, the federal funds rate indirectly influences longer- term interest rates such as mortgages, loans, and savings, all of which are very important to consumer wealth and confidence.(2)
References
(1) Federal Reserve Bank of New York. "Federal funds." Fedpoints, August 2007.
(2) Monetary Policy, Board of Governors of the Federal Reserve System.
(3) The Fed Explained, Board of Governors of the Federal Reserve System
For further information, see The Fed's New Monetary Policy Tools, Page One Economics, Federal Reserve Bank of St. Louis.
For questions on the data, please contact the data source. For questions on FRED functionality, please contact us here.
Suggested Citation:
Board of Governors of the Federal Reserve System (US), Federal Funds Effective Rate [FEDFUNDS], retrieved from FRED, Federal Reserve Bank of St. Louis; https://fred.stlouisfed.org/series/FEDFUNDS, .
Source: Federal Reserve Bank of Chicago
Release: Chicago Fed Survey of Economic Conditions
Units:
Frequency:
Notes:
What is the Survey of Economic Conditions?
Contacts located in the Seventh Federal Reserve District are asked to rate various aspects of economic conditions along a seven-point scale ranging from "large increase" to "large decrease." A series of diffusion indexes summarizing the distribution of responses is then calculated.
How are the indexes constructed?
Respondents' answers on the seven-point scale are assigned a numeric value ranging from +3 to –3. Each diffusion index is calculated as the difference between the number of respondents with answers above their respective average responses and the number of respondents with answers below their respective average responses, divided by the total number of respondents. The index is then multiplied by 100 so that it ranges from +100 to −100 and will be +100 if every respondent provides an above-average answer and –100 if every respondent provides a below-average answer. Respondents with no prior history of responses are excluded from the calculation.
What do the numbers mean?
Respondents' respective average answers to a question can be interpreted as representing their historical trends, or long-run averages. Thus, zero index values indicate, on balance, average growth (or a neutral outlook) for activity, hiring, capital spending, and cost pressures. Positive index values indicate above-average growth (or an optimistic outlook) on balance, and negative values indicate below-average growth (or a pessimistic outlook) on balance.
Beginning with the May 12, 2020 release, the CFSEC moved to a monthly release schedule. This release, with data for April 2020, now contains estimated monthly historical values for the CFSEC indexes, as will all future releases. For additional information on how the survey and indexes changed, see the CFSEC FAQs available here.
Prior to April 2022, the Chicago Fed Survey of Economic Conditions was named the Chicago Fed Survey of Business Conditions (CFSBC). The name change was made to better represent the survey’s aim and base of respondents. The goal of the survey is to assess the state of the economy in the Seventh Federal Reserve District. Moreover, since the beginning of the survey, it was been filled out by both business and nonbusiness contacts.
Suggested Citation:
Federal Reserve Bank of Chicago, Chicago Fed Survey of Economic Conditions: Manufacturing Activity Index in Federal Reserve District 7: Chicago [CFSBCACTIVITYMFG], retrieved from FRED, Federal Reserve Bank of St. Louis; https://fred.stlouisfed.org/series/CFSBCACTIVITYMFG, .
Source: Federal Reserve Bank of St. Louis
Release: Interest Rate Spreads
Units:
Frequency:
Notes:
Starting with the update on June 21, 2019, the Treasury bond data used in calculating interest rate spreads is obtained directly from the U.S. Treasury Department.
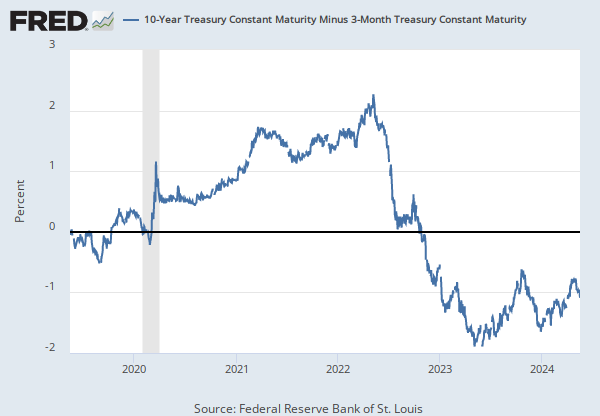
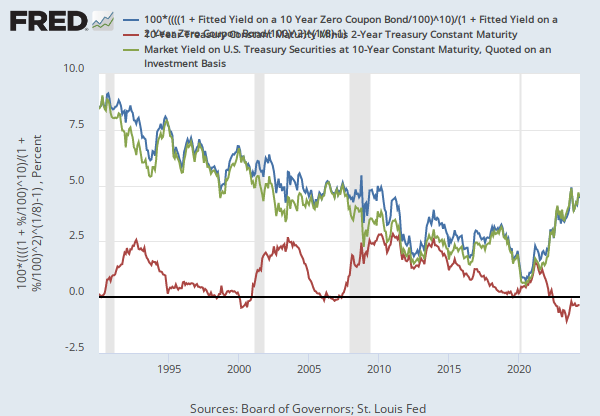
Series is calculated as the spread between 10-Year Treasury Constant Maturity (BC_10YEAR) and 2-Year Treasury Constant Maturity (BC_2YEAR). Both underlying series are published at the U.S. Treasury Department.
Suggested Citation:
Federal Reserve Bank of St. Louis, 10-Year Treasury Constant Maturity Minus 2-Year Treasury Constant Maturity [T10Y2Y], retrieved from FRED, Federal Reserve Bank of St. Louis; https://fred.stlouisfed.org/series/T10Y2Y, .
Release Tables
H.15 Selected Interest Rates
Related Data and Content
Data Suggestions Based On Your Search


Content Suggestions


Other Formats
Federal Funds Effective Rate
Annual, Not Seasonally Adjusted Biweekly, Not Seasonally Adjusted Daily, Not Seasonally Adjusted Daily, Not Seasonally Adjusted Weekly, Not Seasonally Adjusted10-Year Treasury Constant Maturity Minus 2-Year Treasury Constant Maturity
Monthly, Not Seasonally AdjustedRelated Categories
FRB Rates - discount, fed funds, primary credit
Interest Rates
Money, Banking, & Finance
Chicago
Federal Reserve Districts
U.S. Regional Data
Business
Productivity & Costs
Population, Employment, & Labor Markets
Interest Rate Spreads
Releases
More
Series from H.15 Selected Interest Rates
More
Series from Chicago Fed Survey of Economic Conditions
More
Series from Interest Rate Spreads
Tags
H.15 Selected Interest Rates
Federal
Interest Rate
Interest
Board of Governors
Rate
Monthly
Nation
Public Domain: Citation Requested
United States of America
Not Seasonally Adjusted
Chicago Fed Surv. of Economic Conditions
Chicago Fed District
Chicago Fed
Business
Manufacturing
Indexes
Copyrighted: Citation Required
2-Year
Yield Curve
Spread
10-Year
Maturity
Treasury
Daily
St. Louis Fed