Notes
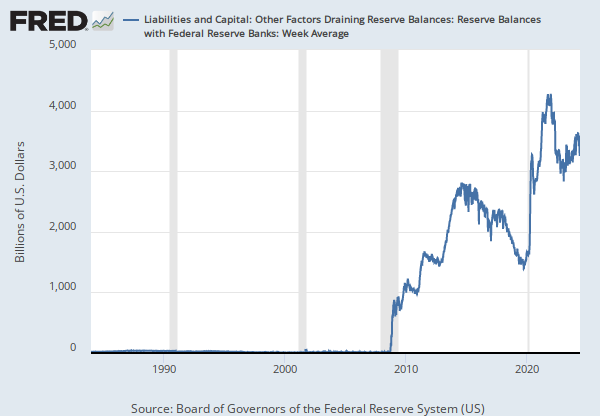
Source: Board of Governors of the Federal Reserve System (US)
Units:
Frequency:
Notes:
Kim and Wright (2005) produced this data by fitting a simple three-factor arbitrage-free term structure model to U.S. Treasury yields since 1990, in order to evaluate the behavior of long-term yields, distant-horizon forward rates, and term premiums. For the full paper, please go to http://www.federalreserve.gov/pubs/feds/2005/200533/200533abs.html
Suggested Citation:
Board of Governors of the Federal Reserve System (US), Term Premium on a 10 Year Zero Coupon Bond [THREEFYTP10], retrieved from FRED, Federal Reserve Bank of St. Louis; https://fred.stlouisfed.org/series/THREEFYTP10, .
Source: Federal Reserve Bank of St. Louis
Release: Interest Rate Spreads
Units:
Frequency:
Notes:
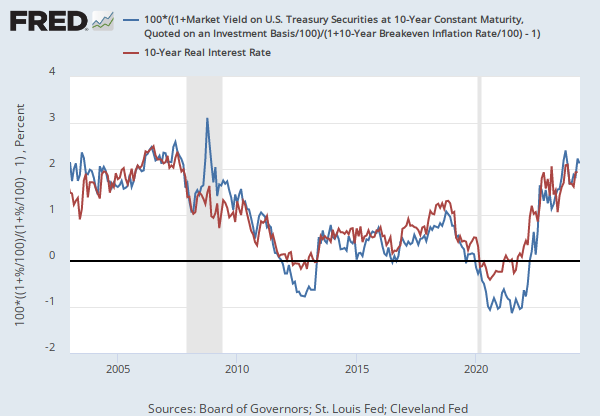
The breakeven inflation rate represents a measure of expected inflation derived from 10-Year Treasury Constant Maturity Securities (DGS10) and 10-Year Treasury Inflation-Indexed Constant Maturity Securities (DFII10). The latest value implies what market participants expect inflation to be in the next 10 years, on average.
Starting with the update on June 21, 2019, the Treasury bond data used in calculating interest rate spreads is obtained directly from the U.S. Treasury Department.
Suggested Citation:
Federal Reserve Bank of St. Louis, 10-Year Breakeven Inflation Rate [T10YIE], retrieved from FRED, Federal Reserve Bank of St. Louis; https://fred.stlouisfed.org/series/T10YIE, .
Release Tables
An Arbitrage-Free Three-Factor Term Structure Model and the Recent Behavior of Long-Term Yields and Distant-Horizon Forward Rates
Related Data and Content
Data Suggestions Based On Your Search


Content Suggestions


Other Formats
Related Categories
Data on the nominal term structure model from Kim and Wright
Academic Data
Interest Rate Spreads
Interest Rates
Money, Banking, & Finance
Releases
More
Series from An Arbitrage-Free Three-Factor Term Structure Model and the Recent Behavior of Long-Term Yields and Distant-Horizon Forward Rates
More
Series from Interest Rate Spreads