Notes
Source: Board of Governors of the Federal Reserve System (US)
Release: Z.1 Financial Accounts of the United States
Units:
Frequency:
Notes:
For more information about the Flow of Funds tables, see the Financial Accounts Guide.##With each quarterly release, the source may make major data and structural revisions to the series and tables. These changes are available in the Release Highlights.##In the Financial Accounts, the source identifies each series by a string of patterned letters and numbers. For a detailed description, including how this series is constructed, see the series analyzer provided by the source.
Suggested Citation:
Board of Governors of the Federal Reserve System (US), Households; Net Worth, Level [BOGZ1FL192090005Q], retrieved from FRED, Federal Reserve Bank of St. Louis; https://fred.stlouisfed.org/series/BOGZ1FL192090005Q, .
Source: U.S. Census Bureau
Release: Housing Vacancies and Homeownership
Units:
Frequency:
Notes:
Data from 1982 are revised based on the 1980 Census. Data from 1993 are revised based on the 1990 Census. Data from 2002 are revised based on the 2000 Census.
The householder refers to the person (or one of the persons) in whose name the housing unit is owned or rented or, if there is no such person, any adult member, excluding roomers, boarders, or paid employees. If the house is jointly owned by a married couple, either the husband or the wife may be listed first, thereby becoming the reference person, or householder, to whom the relationship of the other household members is recorded. One person in each household is designated as the "householder."
This data comes from the Housing Vacancy Survey (HVS) and is weighted to housing units, rather than the population, in order to more accurately estimate the number of occupied and vacant housing units. As a result, estimates of the number of households from the Housing Vacancy Survey (HVS) do not match estimates of households from the Annual Social and Economic Supplement (ASEC).
For more information about the Housing Vacancies and Homeownership survey (HVS) of the Current Population Survey (CPS) see http://www.census.gov/housing/hvs/index.html
Suggested Citation:
U.S. Census Bureau, Household Estimates [TTLHHM156N], retrieved from FRED, Federal Reserve Bank of St. Louis; https://fred.stlouisfed.org/series/TTLHHM156N, .
Source: U.S. Bureau of Labor Statistics
Release: Consumer Price Index
Units:
Frequency:
Notes:
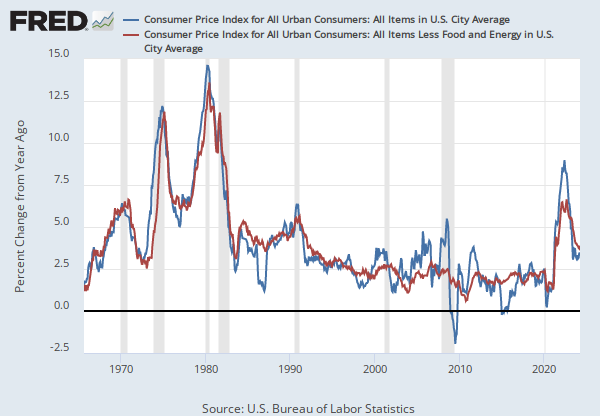
The Consumer Price Index for All Urban Consumers: All Items (CPIAUCSL) is a price index of a basket of goods and services paid by urban consumers. Percent changes in the price index measure the inflation rate between any two time periods. The most common inflation metric is the percent change from one year ago. It can also represent the buying habits of urban consumers. This particular index includes roughly 88 percent of the total population, accounting for wage earners, clerical workers, technical workers, self-employed, short-term workers, unemployed, retirees, and those not in the labor force.
The CPIs are based on prices for food, clothing, shelter, and fuels; transportation fares; service fees (e.g., water and sewer service); and sales taxes. Prices are collected monthly from about 4,000 housing units and approximately 26,000 retail establishments across 87 urban areas. To calculate the index, price changes are averaged with weights representing their importance in the spending of the particular group. The index measures price changes (as a percent change) from a predetermined reference date. In addition to the original unadjusted index distributed, the Bureau of Labor Statistics also releases a seasonally adjusted index. The unadjusted series reflects all factors that may influence a change in prices. However, it can be very useful to look at the seasonally adjusted CPI, which removes the effects of seasonal changes, such as weather, school year, production cycles, and holidays.
The CPI can be used to recognize periods of inflation and deflation. Significant increases in the CPI within a short time frame might indicate a period of inflation, and significant decreases in CPI within a short time frame might indicate a period of deflation. However, because the CPI includes volatile food and oil prices, it might not be a reliable measure of inflationary and deflationary periods. For a more accurate detection, the core CPI (CPILFESL) is often used. When using the CPI, please note that it is not applicable to all consumers and should not be used to determine relative living costs. Additionally, the CPI is a statistical measure vulnerable to sampling error since it is based on a sample of prices and not the complete average.
For more information on the CPI, see the Handbook of Methods, the release notes and announcements, and the Frequently Asked Questions (FAQs).
Suggested Citation:
U.S. Bureau of Labor Statistics, Consumer Price Index for All Urban Consumers: All Items in U.S. City Average [CPIAUCSL], retrieved from FRED, Federal Reserve Bank of St. Louis; https://fred.stlouisfed.org/series/CPIAUCSL, .
Release Tables
Consumer Price Index
Z.1 Financial Accounts of the United States
Related Data and Content
Data Suggestions Based On Your Search










Content Suggestions







Other Formats
Households; Net Worth, Level
Annual, Not Seasonally AdjustedConsumer Price Index for All Urban Consumers: All Items in U.S. City Average
Monthly, Not Seasonally Adjusted Semiannual, Not Seasonally AdjustedRelated Categories
Flow of Funds
National Accounts
Population
Population, Employment, & Labor Markets
Consumer Price Indexes (CPI and PCE)
Prices
Releases
More
Series from Z.1 Financial Accounts of the United States
More
Series from Housing Vacancies and Homeownership
More
Series from Consumer Price Index
Tags
Net Worth
Net
Households
Z.1 US Financial Accounts
Board of Governors
Quarterly
Nation
Public Domain: Citation Requested
United States of America
Not Seasonally Adjusted
Census
Monthly
Headline Figure
Average
All Items
Urban
Consumer
Consumer Price Index
Inflation
Price Index
Indexes
Seasonally Adjusted
Price
Bureau of Labor Statistics