Notes
Source: Federal Reserve Bank of St. Louis
Release: Interest Rate Spreads
Units:
Frequency:
Notes:
Starting with the update on June 21, 2019, the Treasury bond data used in calculating interest rate spreads is obtained directly from the U.S. Treasury Department.
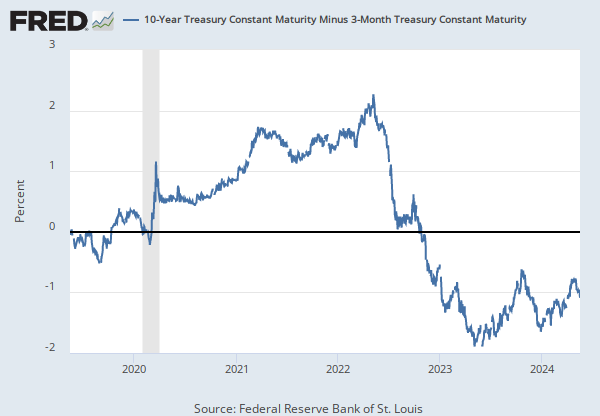
Series is calculated as the spread between 10-Year Treasury Constant Maturity (BC_10YEAR) and 2-Year Treasury Constant Maturity (BC_2YEAR). Both underlying series are published at the U.S. Treasury Department.
Suggested Citation:
Federal Reserve Bank of St. Louis, 10-Year Treasury Constant Maturity Minus 2-Year Treasury Constant Maturity [T10Y2Y], retrieved from FRED, Federal Reserve Bank of St. Louis; https://fred.stlouisfed.org/series/T10Y2Y, .
Source: Organization for Economic Co-operation and Development
Release: Main Economic Indicators
Units:
Frequency:
Notes:
OECD Data Filters:
REF_AREA: USA
MEASURE: CPI
UNIT_MEASURE: IX
METHODOLOGY: N
EXPENDITURE: _T
ADJUSTMENT: N
TRANSFORMATION: _Z
FREQ: M
All OECD data should be cited as follows: OECD (year), (dataset name), (data source) DOI or https://data-explorer.oecd.org/. (accessed on (date)).
Suggested Citation:
Organization for Economic Co-operation and Development, Consumer Price Indices (CPIs, HICPs), COICOP 1999: Consumer Price Index: Total for United States [USACPIALLMINMEI], retrieved from FRED, Federal Reserve Bank of St. Louis; https://fred.stlouisfed.org/series/USACPIALLMINMEI, .
Release Tables
Main Economic Indicators
Related Data and Content
Data Suggestions Based On Your Search


Content Suggestions


Other Formats
10-Year Treasury Constant Maturity Minus 2-Year Treasury Constant Maturity
Monthly, Not Seasonally AdjustedConsumer Price Indices (CPIs, HICPs), COICOP 1999: Consumer Price Index: Total for United States
Contribution to growth rate, over 1 year, Monthly, Not Seasonally Adjusted Growth rate same period previous year, Annual, Not Seasonally Adjusted Growth rate same period previous year, Annual, Not Seasonally Adjusted Growth rate same period previous year, Monthly, Not Seasonally Adjusted Growth rate same period previous year, Monthly, Not Seasonally Adjusted Growth rate same period previous year, Quarterly, Not Seasonally Adjusted Annual, Not Seasonally Adjusted Annual, Not Seasonally Adjusted Annual, Seasonally Adjusted Monthly, Not Seasonally Adjusted Monthly, Seasonally Adjusted Quarterly, Not Seasonally Adjusted Quarterly, Seasonally AdjustedRelated Categories
Interest Rate Spreads
Interest Rates
Money, Banking, & Finance
Consumer Price Indexes
Prices
Indicators
United States
Countries
International Data
Releases
Tags
2-Year
Yield Curve
Spread
10-Year
Maturity
Treasury
Interest Rate
Interest
Daily
St. Louis Fed
Rate
Copyrighted: Citation Required
Nation
United States of America
Not Seasonally Adjusted
All Items
Consumer Price Index
Main Economic Indicators
Org. for Economic Co-operation and Development
Price Index
Indexes
Price
Monthly