Notes
Source: Board of Governors of the Federal Reserve System (US)
Release: Z.1 Financial Accounts of the United States
Units:
Frequency:
Notes:
For more information about the Flow of Funds tables, see the Financial Accounts Guide.
With each quarterly release, the source may make major data and structural revisions to the series and tables. These changes are available in the Release Highlights.
In the Financial Accounts, the source identifies each series by a string of patterned letters and numbers. For a detailed description, including how this series is constructed, see the series analyzer provided by the source.
Suggested Citation:
Board of Governors of the Federal Reserve System (US), Interest Rates and Price Indexes; Multi-Family Real Estate Apartment Price Index, Level [BOGZ1FL075035403Q], retrieved from FRED, Federal Reserve Bank of St. Louis; https://fred.stlouisfed.org/series/BOGZ1FL075035403Q, .
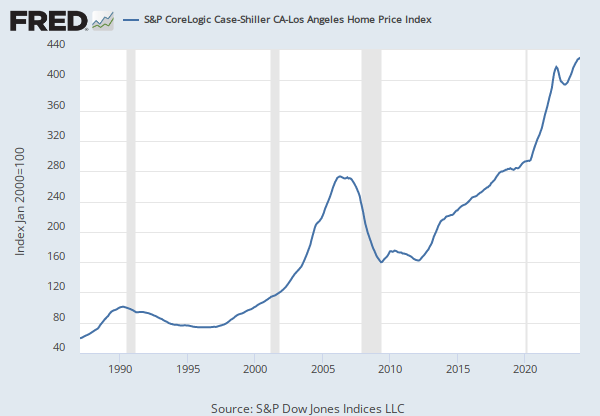
Source: S&P Dow Jones Indices LLC
Release: S&P Cotality Case-Shiller Home Price Indices
Units:
Frequency:
Notes:
For more information regarding the index, please visit Standard and Poor's.
Copyright © 2016, S&P Dow Jones Indices LLC. All rights reserved. Reproduction of S&P Case-Shiller 20-City Home Price Index in any form is prohibited except with the prior written permission of S&P Dow Jones Indices LLC "S&P". S&P does not guarantee the accuracy, adequacy, completeness or availability of any information and is not responsible for any errors or omissions, regardless of the cause or for the results obtained from the use of such information. S&P DISCLAIMS ANY AND ALL EXPRESS OR IMPLIED WARRANTIES, INCLUDING, BUT NOT LIMITED TO, ANY WARRANTIES OF MERCHANTABILITY OR FITNESS FOR A PARTICULAR PURPOSE OR USE. In no event shall S&P be liable for any direct, indirect, special or consequential damages, costs, expenses, legal fees, or losses (including lost income or lost profit and opportunity costs) in connection with subscriber's or others' user of S&P Case-Shiller 20-City Home Price Index.
Permission to reproduce this series can be requested from index_services@spdji.com. More contact details are available, including phone numbers for all regional offices.
Suggested Citation:
S&P Dow Jones Indices LLC, S&P Cotality Case-Shiller 20-City Composite Home Price Index [SPCS20RSA], retrieved from FRED, Federal Reserve Bank of St. Louis; https://fred.stlouisfed.org/series/SPCS20RSA, .
Source: Nasdaq, Inc.
Release: Nasdaq Daily Index Data
Units:
Frequency:
Notes:
The observations for the NASDAQ 100 Index represent the daily index value at market close. The market typically closes at 4 PM ET, except for holidays when it sometimes closes early.
The NASDAQ 100 Index includes 100 of the largest domestic and international non-financial securities listed on The NASDAQ Stock Market based on market capitalization.
Copyright © 2016, NASDAQ OMX Group, Inc.
Suggested Citation:
Nasdaq, Inc., NASDAQ-100 [NASDAQ100], retrieved from FRED, Federal Reserve Bank of St. Louis; https://fred.stlouisfed.org/series/NASDAQ100, .
Release Tables
S&P Cotality Case-Shiller Home Price Indices
Related Data and Content
Data Suggestions Based On Your Search


Content Suggestions


Other Formats
Interest Rates and Price Indexes; Multi-Family Real Estate Apartment Price Index, Level
Annual, Not Seasonally AdjustedS&P Cotality Case-Shiller 20-City Composite Home Price Index
Monthly, Not Seasonally AdjustedRelated Categories
Flow of Funds
National Accounts
House Price Indexes
Prices
Stock Market Indexes
Financial Indicators
Money, Banking, & Finance
Releases
More
Series from Z.1 Financial Accounts of the United States
More
Series from S&P Cotality Case-Shiller Home Price Indices
More
Series from Nasdaq Daily Index Data
Tags
Multifamily
Real Estate
Family
Z.1 US Financial Accounts
Interest Rate
Interest
Board of Governors
Rate
Price Index
Quarterly
Indexes
Price
Nation
Public Domain: Citation Requested
United States of America
Not Seasonally Adjusted
S&P Cotality Case-Shiller Home Price Indices
S&P Dow Jones Indices LLC
House Price Index
Copyrighted: Pre-Approval Required
Housing
Seasonally Adjusted
Monthly
Stock Market
National Association of Securities Dealers Automated Quotations
Nasdaq, Inc.
Daily
Copyrighted: Citation Required