Notes
Source: Federal Reserve Bank of St. Louis
Release: Interest Rate Spreads
Units:
Frequency:
Notes:
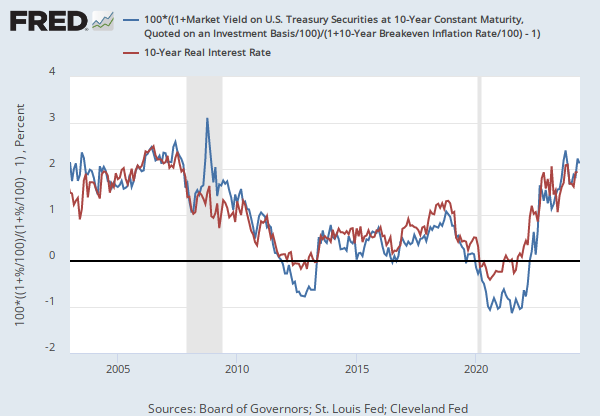
The breakeven inflation rate represents a measure of expected inflation derived from 10-Year Treasury Constant Maturity Securities (DGS10) and 10-Year Treasury Inflation-Indexed Constant Maturity Securities (DFII10). The latest value implies what market participants expect inflation to be in the next 10 years, on average.
Starting with the update on June 21, 2019, the Treasury bond data used in calculating interest rate spreads is obtained directly from the U.S. Treasury Department.
Suggested Citation:
Federal Reserve Bank of St. Louis, 10-Year Breakeven Inflation Rate [T10YIE], retrieved from FRED, Federal Reserve Bank of St. Louis; https://fred.stlouisfed.org/series/T10YIE, .
Source: Board of Governors of the Federal Reserve System (US)
Release: H.15 Selected Interest Rates
Units:
Frequency:
Notes:
For further information regarding treasury constant maturity data, please refer to the H.15 Statistical Release notes and the Treasury Yield Curve Methodology.
For questions on the data, please contact the data source. For questions on FRED functionality, please contact us here.
Suggested Citation:
Board of Governors of the Federal Reserve System (US), Market Yield on U.S. Treasury Securities at 10-Year Constant Maturity, Quoted on an Investment Basis, Inflation-Indexed [DFII10], retrieved from FRED, Federal Reserve Bank of St. Louis; https://fred.stlouisfed.org/series/DFII10, .
Source: Nasdaq, Inc.
Release: Nasdaq Daily Index Data
Units:
Frequency:
Notes:
The observations for the NASDAQ Composite Index represent the daily index value at market close. The market typically closes at 4 PM ET, except for holidays when it sometimes closes early.
The NASDAQ Composite Index is a market capitalization weighted index with more than 3000 common equities listed on the NASDAQ Stock Market. The types of securities in the index include American depositary receipts (ADRs), common stocks, real estate investment trusts (REITs), and tracking stocks. The index includes all NASDAQ listed stocks that are not derivatives, preferred shares, funds, exchange-traded funds (ETFs) or debentures.
Copyright © 2016, NASDAQ OMX Group, Inc.
Suggested Citation:
Nasdaq, Inc., NASDAQ Composite [NASDAQCOM], retrieved from FRED, Federal Reserve Bank of St. Louis; https://fred.stlouisfed.org/series/NASDAQCOM, .
Source: Federal Reserve Bank of St. Louis
Release: Interest Rate Spreads
Units:
Frequency:
Notes:
This series is a measure of expected inflation (on average) over the five-year period that begins five years from today.
This series is constructed as:
(((((1+((BC_10YEAR-TC_10YEAR)/100))^10)/((1+((BC_5YEAR-TC_5YEAR)/100))^5))^0.2)-1)*100
where BC10_YEAR, TC_10YEAR, BC_5YEAR, and TC_5YEAR are the 10 year and 5 year nominal and inflation adjusted Treasury securities.
Starting with the update on June 21, 2019, the Treasury bond data used in calculating interest rate spreads is obtained directly from the U.S. Treasury Department.
Suggested Citation:
Federal Reserve Bank of St. Louis, 5-Year, 5-Year Forward Inflation Expectation Rate [T5YIFR], retrieved from FRED, Federal Reserve Bank of St. Louis; https://fred.stlouisfed.org/series/T5YIFR, .
Release Tables
H.15 Selected Interest Rates
Related Data and Content
Data Suggestions Based On Your Search


Content Suggestions


Other Formats
10-Year Breakeven Inflation Rate
Monthly, Not Seasonally AdjustedMarket Yield on U.S. Treasury Securities at 10-Year Constant Maturity, Quoted on an Investment Basis, Inflation-Indexed
Annual, Not Seasonally Adjusted Monthly, Not Seasonally Adjusted Weekly, Not Seasonally Adjusted5-Year, 5-Year Forward Inflation Expectation Rate
Monthly, Not Seasonally AdjustedRelated Categories
Interest Rate Spreads
Interest Rates
Money, Banking, & Finance
Treasury Inflation-Indexed Securities
Treasury Constant Maturity
Stock Market Indexes
Financial Indicators
Releases
More
Series from Interest Rate Spreads
More
Series from H.15 Selected Interest Rates
More
Series from Nasdaq Daily Index Data
Tags
Spread
10-Year
Interest Rate
Interest
Daily
St. Louis Fed
Inflation
Rate
Copyrighted: Citation Required
Nation
United States of America
Not Seasonally Adjusted
Treasury Inflation-Indexes Securities (TIPS)
Maturity
H.15 Selected Interest Rates
Treasury
Securities
Real
Board of Governors
Public Domain: Citation Requested
Composite
Stock Market
National Association of Securities Dealers Automated Quotations
Nasdaq, Inc.
Copyrighted: Pre-Approval Required
Indexes
5-Year