Notes
Source: National Bureau of Economic Research
Release: NBER Macrohistory Database
Units:
Frequency:
Notes:
Series Is Presented Here As Two Variables--(1)--Original Data, 1897-1916 (2)--Original Data, 1914-1958 20 Stocks Are Used Through September, 1928 And 30 Stocks Thereafter. A Detailed Description Of Methods Of Constucting Averages Is Given In "Basis Of Calculation Of Dow-Jones Average" Available From The Wall Street Journal. For A More Detailed Description Of The Series, See Business Cycle Indicators, Vol. Ii, Moore, NBER. This Index Is Based On Daily Closing Prices On The New York Stock Exchange. Through 1948, Averages Of Highest And Lowest Indexes For The Month Are Used. For 1949-1968, Averages Of Daily Closing Indexes Are Used. Source: Data Were Compiled By Dow Jones And Company From Quotations In The Wall Street Journal. Through June, 1952, Data Are From The Dow-Jones Averages, 13Th Edition, 1948, And Supplementary Averages (Barron'S Publishing Company). Thereafter, Through 1968, Data Are From Barron'S National Business And Financial Weekly.
This NBER data series m11009b appears on the NBER website in Chapter 11 at http://www.nber.org/databases/macrohistory/contents/chapter11.html.
NBER Indicator: m11009b
Suggested Citation:
National Bureau of Economic Research, Dow-Jones Industrial Stock Price Index for United States [M1109BUSM293NNBR], retrieved from FRED, Federal Reserve Bank of St. Louis; https://fred.stlouisfed.org/series/M1109BUSM293NNBR, .
Source: Board of Governors of the Federal Reserve System (US)
Release: G.17 Industrial Production and Capacity Utilization
Units:
Frequency:
Notes:
The Federal Reserve's monthly index of industrial production and the related capacity indexes and capacity utilization rates cover manufacturing, mining, and electric and gas utilities. The industrial sector, together with construction, accounts for the bulk of the variation in national output over the course of the business cycle. The industrial detail provided by these measures helps illuminate structural developments in the economy. The industrial production (IP) index measures the real output of all relevant establishments located in the United States, regardless of their ownership, but not those located in U.S. territories. For more information, see the explanatory notes issued by the Board of Governors. For recent updates, see the announcements issued by the Board of Governors.
Suggested Citation:
Board of Governors of the Federal Reserve System (US), Industrial Production: Total Index [INDPRO], retrieved from FRED, Federal Reserve Bank of St. Louis; https://fred.stlouisfed.org/series/INDPRO, .
Source: U.S. Bureau of Labor Statistics
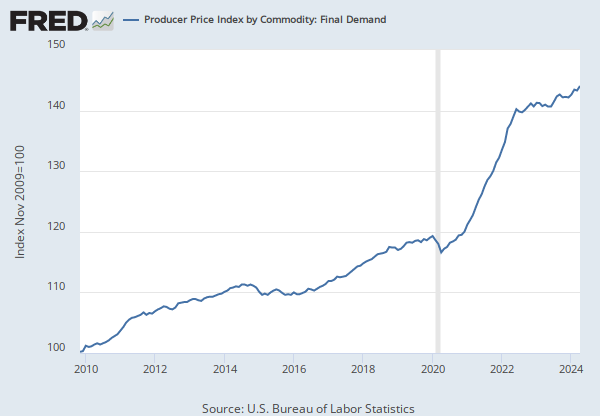
Release: Producer Price Index
Units:
Frequency:
Suggested Citation:
U.S. Bureau of Labor Statistics, Producer Price Index by Commodity: All Commodities [PPIACO], retrieved from FRED, Federal Reserve Bank of St. Louis; https://fred.stlouisfed.org/series/PPIACO, .
Release Tables
G.17 Industrial Production and Capacity Utilization
- Industrial Production and Capacity Utilization: Summary: Monthly, Seasonally Adjusted
- Industrial Production Indexes: Market and Industry Group: Monthly, Seasonally Adjusted
Producer Price Index
Related Data and Content
Data Suggestions Based On Your Search


Content Suggestions


Other Formats
Dow-Jones Industrial Stock Price Index for United States
Monthly, Not Seasonally AdjustedIndustrial Production: Total Index
Annual, Not Seasonally Adjusted Monthly, Not Seasonally Adjusted Quarterly, Not Seasonally Adjusted Quarterly, Seasonally AdjustedRelated Categories
Security Markets
NBER Macrohistory Database
Academic Data
Industrial Production & Capacity Utilization
Production & Business Activity
Producer Price Indexes (PPI)
Prices
Releases
More
Series from NBER Macrohistory Database
More
Series from G.17 Industrial Production and Capacity Utilization
More
Series from Producer Price Index
Tags
Stock Market
National Bureau of Economic Research
Industry
Price Index
Indexes
Price
Copyrighted: Citation Required
Monthly
Nation
United States of America
Not Seasonally Adjusted
Headline Figure
G.17 Industr. Production & Capacity Utilization
Industrial Production
Production
Board of Governors
Seasonally Adjusted
Public Domain: Citation Requested
Commodities
Producer Price Index
Inflation
Bureau of Labor Statistics