FRED Graph

Your trusted data source
since 1991.
Source: Wilshire Associates
Release: Wilshire Indexes
Units:
Frequency:
The observations for the Wilshire 5000 Full Cap Price Index represent the daily index value at market close. The market typically closes at 4 PM ET, except for holidays when it sometimes closes early.
The price indexes are price returns, which do not reinvest dividends. The designation Full Cap for an index signifies a float adjusted market capitalization that includes shares of stock not considered available to "ordinary" investors. Copyright, 2016, Wilshire Associates Incorporated. Reprinted with permission. For more information about the various indexes, visit Wilshire Associates.
Wilshire Associates, Wilshire 5000 Full Cap Price Index (DISCONTINUED) [WILL5000PRFC], retrieved from FRED, Federal Reserve Bank of St. Louis; https://fred.stlouisfed.org/series/WILL5000PRFC, April 30, 2024.
Source: Board of Governors of the Federal Reserve System (US)
Release: Z.1 Financial Accounts of the United States
Units:
Frequency:
The Mortgage Debt Outstanding table is no longer being updated as of March 2020. Many of the series that were published in this table can be found in the Z1 Financial Accounts of the United States release. The Z1 equivalent of this series is found at ASTMA.
For further information, please refer to the Board of Governors of the Federal Reserve System's Mortgage Debt Outstanding.
Board of Governors of the Federal Reserve System (US), Mortgage Debt Outstanding, All holders (DISCONTINUED) [MDOAH], retrieved from FRED, Federal Reserve Bank of St. Louis; https://fred.stlouisfed.org/series/MDOAH, April 30, 2024.
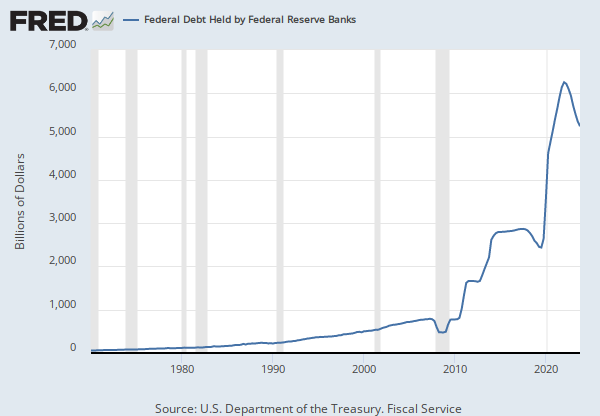
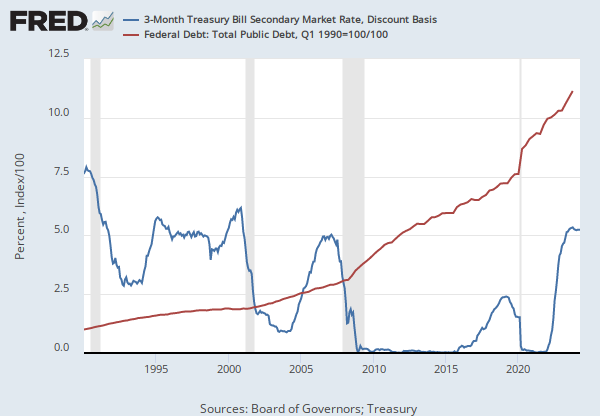
Source: U.S. Department of the Treasury. Fiscal Service
Release: Treasury Bulletin
Units:
Frequency:
U.S. Department of the Treasury. Fiscal Service, Federal Debt: Total Public Debt [GFDEBTN], retrieved from FRED, Federal Reserve Bank of St. Louis; https://fred.stlouisfed.org/series/GFDEBTN, April 30, 2024.
Source: Board of Governors of the Federal Reserve System (US)
Release: Z.1 Financial Accounts of the United States
Units:
Frequency:
Source ID: FL104122005.Q
For more information about the Flow of Funds tables, see the Financial Accounts Guide.
With each quarterly release, the source may make major data and structural revisions to the series and tables. These changes are available in the Release Highlights.
In the Financial Accounts, the source identifies each series by a string of patterned letters and numbers. For a detailed description, including how this series is constructed, see the series analyzer provided by the source.
Board of Governors of the Federal Reserve System (US), Nonfinancial Corporate Business; Debt Securities; Liability, Level [NCBDBIQ027S], retrieved from FRED, Federal Reserve Bank of St. Louis; https://fred.stlouisfed.org/series/NCBDBIQ027S, April 30, 2024.
Source: National Bureau of Economic Research
Release: NBER Macrohistory Database
Units:
Frequency:
Series Is Presented Here As Two Variables--(1)--Original Data, 1897-1916 (2)--Original Data, 1914-1958 20 Stocks Are Used Through September, 1928 And 30 Stocks Thereafter. A Detailed Description Of Methods Of Constucting Averages Is Given In "Basis Of Calculation Of Dow-Jones Average" Available From The Wall Street Journal. For A More Detailed Description Of The Series, See Business Cycle Indicators, Vol. Ii, Moore, NBER. This Index Is Based On Daily Closing Prices On The New York Stock Exchange. Through 1948, Averages Of Highest And Lowest Indexes For The Month Are Used. For 1949-1968, Averages Of Daily Closing Indexes Are Used. Source: Data Were Compiled By Dow Jones And Company From Quotations In The Wall Street Journal. Through June, 1952, Data Are From The Dow-Jones Averages, 13Th Edition, 1948, And Supplementary Averages (Barron'S Publishing Company). Thereafter, Through 1968, Data Are From Barron'S National Business And Financial Weekly.
This NBER data series m11009b appears on the NBER website in Chapter 11 at http://www.nber.org/databases/macrohistory/contents/chapter11.html.
NBER Indicator: m11009b
National Bureau of Economic Research, Dow-Jones Industrial Stock Price Index for United States [M1109BUSM293NNBR], retrieved from FRED, Federal Reserve Bank of St. Louis; https://fred.stlouisfed.org/series/M1109BUSM293NNBR, April 30, 2024.
Nonfinancial Corporate Business; Debt Securities; Liability, Level
Annual, Not Seasonally AdjustedDow-Jones Industrial Stock Price Index for United States
Monthly, Not Seasonally Adjusted