Notes
Source: Federal Reserve Bank of St. Louis
Release: Interest Rate Spreads
Units:
Frequency:
Notes:
Starting with the update on June 21, 2019, the Treasury bond data used in calculating interest rate spreads is obtained directly from the U.S. Treasury Department.
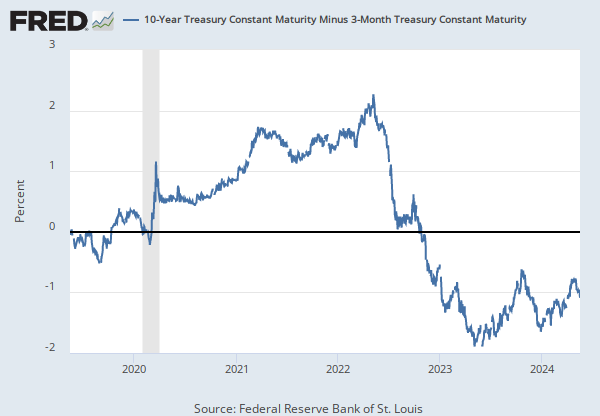
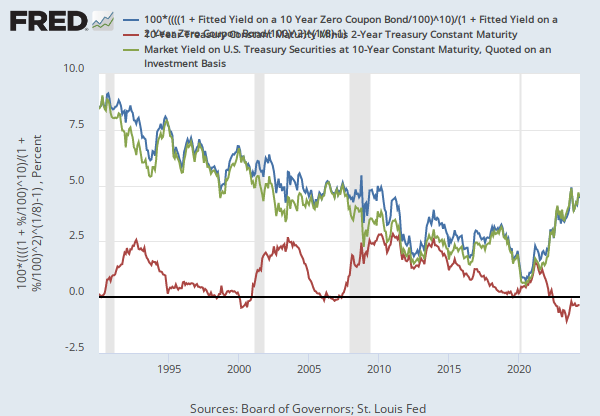
Series is calculated as the spread between 10-Year Treasury Constant Maturity (BC_10YEAR) and 2-Year Treasury Constant Maturity (BC_2YEAR). Both underlying series are published at the U.S. Treasury Department.
Suggested Citation:
Federal Reserve Bank of St. Louis, 10-Year Treasury Constant Maturity Minus 2-Year Treasury Constant Maturity [T10Y2Y], retrieved from FRED, Federal Reserve Bank of St. Louis; https://fred.stlouisfed.org/series/T10Y2Y, .
Source: Nasdaq, Inc.
Release: Nasdaq Daily Index Data
Units:
Frequency:
Notes:
The observations for the NASDAQ Composite Index represent the daily index value at market close. The market typically closes at 4 PM ET, except for holidays when it sometimes closes early.
The NASDAQ Composite Index is a market capitalization weighted index with more than 3000 common equities listed on the NASDAQ Stock Market. The types of securities in the index include American depositary receipts (ADRs), common stocks, real estate investment trusts (REITs), and tracking stocks. The index includes all NASDAQ listed stocks that are not derivatives, preferred shares, funds, exchange-traded funds (ETFs) or debentures.
Copyright © 2016, NASDAQ OMX Group, Inc.
Suggested Citation:
Nasdaq, Inc., NASDAQ Composite [NASDAQCOM], retrieved from FRED, Federal Reserve Bank of St. Louis; https://fred.stlouisfed.org/series/NASDAQCOM, .
Related Data and Content
Data Suggestions Based On Your Search


Content Suggestions


Other Formats
Related Categories
Interest Rate Spreads
Interest Rates
Money, Banking, & Finance
Stock Market Indexes
Financial Indicators
Releases
Tags
2-Year
Yield Curve
Spread
10-Year
Maturity
Treasury
Interest Rate
Interest
Daily
St. Louis Fed
Rate
Copyrighted: Citation Required
Nation
United States of America
Not Seasonally Adjusted
Composite
Stock Market
National Association of Securities Dealers Automated Quotations
Nasdaq, Inc.
Copyrighted: Pre-Approval Required
Indexes