Federal Reserve Economic Data

FRED Graph

1Y | 5Y | 10Y | Max
to
Date:
  EDIT LINE 1
(a) All Sectors; Debt Securities and Loans; Liability, Level, Billions of Dollars, Not Seasonally Adjusted (TCMDO)
Source ID: FL894104005.Q For more information about the Flow of Funds tables, see the Financial Accounts Guide (https://www.federalreserve.gov/apps/fof/Default.aspx). With each quarterly release, the source may make major data and structural revisions to the series and tables. These changes are available in the Release Highlights (https://www.federalreserve.gov/apps/fof/FOFHighlight.aspx). In the Financial Accounts, the source identifies each series by a string of patterned letters and numbers. For a detailed description, including how this series is constructed, see the series analyzer (https://www.federalreserve.gov/apps/fof/SeriesAnalyzer.aspx?s=FL894104005&t=) provided by the source.

Select a date that will equal 100 for your custom index:
  Enter date as YYYY-MM-DD
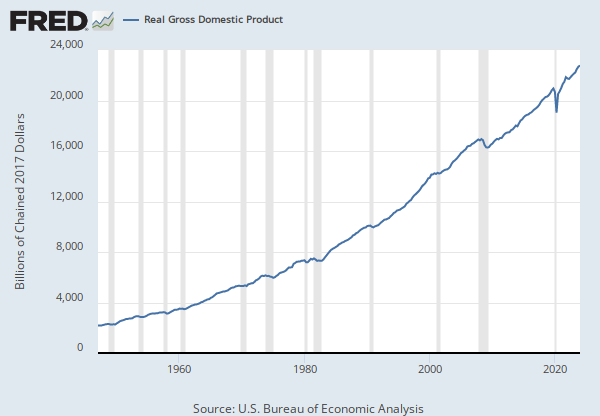
(b) Gross Domestic Product, Billions of Dollars, Seasonally Adjusted Annual Rate (GDP)
BEA Account Code: A191RC Gross domestic product (GDP), the featured measure of U.S. output, is the market value of the goods and services produced by labor and property located in the United States.For more information, see the Guide to the National Income and Product Accounts of the United States (NIPA) and the Bureau of Economic Analysis (http://www.bea.gov/national/pdf/nipaguid.pdf).

Select a date that will equal 100 for your custom index:
  Enter date as YYYY-MM-DD
to

Write a custom formula to transform one or more series or combine two or more series.

You can begin by adding a series to combine with your existing series.

Select...

    Now create a custom formula to combine or transform the series.
    Need help? []

    For example, invert an exchange rate by using formula 1/a, where “a” refers to the first FRED data series added to this line. Or calculate the spread between 2 interest rates, a and b, by using the formula a - b.

    Use the assigned data series variables (a, b, c, etc.) together with operators (+, -, *, /, ^, etc.), parentheses and constants (1, 1.5, 2, etc.) to create your own formula (e.g., 1/a, a-b, (a+b)/2, (a/(a+b+c))*100). As noted above, you may add other data series to this line before entering a formula.

    Finally, you can change the units of your new series.

    Select a date that will equal 100 for your custom index:
        Enter date as YYYY-MM-DD

      EDIT LINE 2
    (a) Gross Domestic Product, Billions of Dollars, Seasonally Adjusted Annual Rate (GDP)
    BEA Account Code: A191RC Gross domestic product (GDP), the featured measure of U.S. output, is the market value of the goods and services produced by labor and property located in the United States.For more information, see the Guide to the National Income and Product Accounts of the United States (NIPA) and the Bureau of Economic Analysis (http://www.bea.gov/national/pdf/nipaguid.pdf).

    Select a date that will equal 100 for your custom index:
      Enter date as YYYY-MM-DD
    to

    Write a custom formula to transform one or more series or combine two or more series.

    You can begin by adding a series to combine with your existing series.

    Select...

      Now create a custom formula to combine or transform the series.
      Need help? []

      For example, invert an exchange rate by using formula 1/a, where “a” refers to the first FRED data series added to this line. Or calculate the spread between 2 interest rates, a and b, by using the formula a - b.

      Use the assigned data series variables (a, b, c, etc.) together with operators (+, -, *, /, ^, etc.), parentheses and constants (1, 1.5, 2, etc.) to create your own formula (e.g., 1/a, a-b, (a+b)/2, (a/(a+b+c))*100). As noted above, you may add other data series to this line before entering a formula.

      Finally, you can change the units of your new series.

      Select a date that will equal 100 for your custom index:
          Enter date as YYYY-MM-DD

        EDIT LINE 3
      (a) All Sectors; Debt Securities and Loans; Liability, Level, Billions of Dollars, Not Seasonally Adjusted (TCMDO)
      Source ID: FL894104005.Q For more information about the Flow of Funds tables, see the Financial Accounts Guide (https://www.federalreserve.gov/apps/fof/Default.aspx). With each quarterly release, the source may make major data and structural revisions to the series and tables. These changes are available in the Release Highlights (https://www.federalreserve.gov/apps/fof/FOFHighlight.aspx). In the Financial Accounts, the source identifies each series by a string of patterned letters and numbers. For a detailed description, including how this series is constructed, see the series analyzer (https://www.federalreserve.gov/apps/fof/SeriesAnalyzer.aspx?s=FL894104005&t=) provided by the source.

      Select a date that will equal 100 for your custom index:
        Enter date as YYYY-MM-DD
      (b) Gross Domestic Product, Billions of Dollars, Seasonally Adjusted Annual Rate (GDP)
      BEA Account Code: A191RC Gross domestic product (GDP), the featured measure of U.S. output, is the market value of the goods and services produced by labor and property located in the United States.For more information, see the Guide to the National Income and Product Accounts of the United States (NIPA) and the Bureau of Economic Analysis (http://www.bea.gov/national/pdf/nipaguid.pdf).

      Select a date that will equal 100 for your custom index:
        Enter date as YYYY-MM-DD
      to

      Write a custom formula to transform one or more series or combine two or more series.

      You can begin by adding a series to combine with your existing series.

      Select...

        Now create a custom formula to combine or transform the series.
        Need help? []

        For example, invert an exchange rate by using formula 1/a, where “a” refers to the first FRED data series added to this line. Or calculate the spread between 2 interest rates, a and b, by using the formula a - b.

        Use the assigned data series variables (a, b, c, etc.) together with operators (+, -, *, /, ^, etc.), parentheses and constants (1, 1.5, 2, etc.) to create your own formula (e.g., 1/a, a-b, (a+b)/2, (a/(a+b+c))*100). As noted above, you may add other data series to this line before entering a formula.

        Finally, you can change the units of your new series.

        Select a date that will equal 100 for your custom index:
            Enter date as YYYY-MM-DD

        ADDLINE

        Add data series to graph:

        Type keywords to search for data
        Create user-defined line? []
        You can customize a graph by adding a straight line between two data points.
        FORMAT GRAPH
        Log scale:
        Show:
        Color:
        Graph frame
        Plot area
        Text

         LINE 1: 100 * All Sectors; Debt Securities and Loans; Liability, Level / Gross Domestic Product
        Color:


         LINE 2: 100 * Gross Domestic Product / Gross Domestic Product
        Color:


         LINE 3: 100 * All Sectors; Debt Securities and Loans; Liability, Level / Gross Domestic Product
        Color:


        NOTES

        Source: Board of Governors of the Federal Reserve System (US)  

        Release: Z.1 Financial Accounts of the United States  

        Units:  Billions of Dollars, Not Seasonally Adjusted

        Frequency:  Quarterly, End of Period

        Notes:

        Source ID: FL894104005.Q

        For more information about the Flow of Funds tables, see the Financial Accounts Guide.

        With each quarterly release, the source may make major data and structural revisions to the series and tables. These changes are available in the Release Highlights.

        In the Financial Accounts, the source identifies each series by a string of patterned letters and numbers. For a detailed description, including how this series is constructed, see the series analyzer provided by the source.

        Suggested Citation:

        Board of Governors of the Federal Reserve System (US), All Sectors; Debt Securities and Loans; Liability, Level [TCMDO], retrieved from FRED, Federal Reserve Bank of St. Louis; https://fred.stlouisfed.org/series/TCMDO, January 14, 2025.

        Source: U.S. Bureau of Economic Analysis  

        Release: Gross Domestic Product  

        Units:  Billions of Dollars, Seasonally Adjusted Annual Rate

        Frequency:  Quarterly

        Notes:

        BEA Account Code: A191RC

        Gross domestic product (GDP), the featured measure of U.S. output, is the market value of the goods and services produced by labor and property located in the United States.For more information, see the Guide to the National Income and Product Accounts of the United States (NIPA) and the Bureau of Economic Analysis.

        Suggested Citation:

        U.S. Bureau of Economic Analysis, Gross Domestic Product [GDP], retrieved from FRED, Federal Reserve Bank of St. Louis; https://fred.stlouisfed.org/series/GDP, January 14, 2025.

        RELATED DATA AND CONTENT

        Data Suggestions Based On Your Search

        Content Suggestions

        Other Formats

        Related Categories

        Releases

        Tags


        Subscribe to the FRED newsletter


        Follow us

        Back to Top