Notes
Source: Board of Governors of the Federal Reserve System (US)
Release: H.6 Money Stock Measures
Units:
Frequency:
Notes:
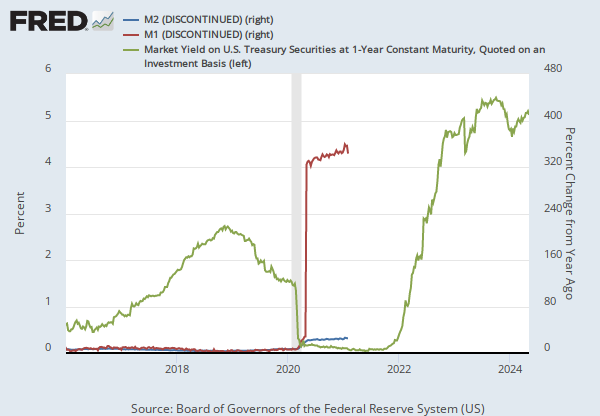
This weekly series is discontinued and will no longer be updated. The non-seasonally adjusted version of this weekly series is WM2NS, and the seasonally adjusted monthly series is M2SL.
Starting on February 23, 2021, the H.6 statistical release is now published at a monthly frequency and contains only monthly average data needed to construct the monetary aggregates. Weekly average, non-seasonally adjusted data will continue to be made available, while weekly average, seasonally adjusted data will no longer be provided. For further information about the changes to the H.6 statistical release, see the announcements provided by the source.
Before May 2020, M2 consists of M1 plus (1) savings deposits (including money market deposit accounts); (2) small-denomination time deposits (time deposits in amounts of less than $100,000) less individual retirement account (IRA) and Keogh balances at depository institutions; and (3) balances in retail money market funds (MMFs) less IRA and Keogh balances at MMFs.
Beginning May 2020, M2 consists of M1 plus (1) small-denomination time deposits (time deposits in amounts of less than $100,000) less IRA and Keogh balances at depository institutions; and (2) balances in retail MMFs less IRA and Keogh balances at MMFs. Seasonally adjusted M2 is constructed by summing savings deposits (before May 2020), small-denomination time deposits, and retail MMFs, each seasonally adjusted separately, and adding this result to seasonally adjusted M1. For more information on the H.6 release changes and the regulatory amendment that led to the creation of the other liquid deposits component and its inclusion in the M1 monetary aggregate, see the H.6 announcements and Technical Q&As posted on December 17, 2020.
For questions on the data, please contact the data source. For questions on FRED functionality, please contact us here.
Suggested Citation:
Board of Governors of the Federal Reserve System (US), M2 (DISCONTINUED) [M2], retrieved from FRED, Federal Reserve Bank of St. Louis; https://fred.stlouisfed.org/series/M2, .
Source: U.S. Census Bureau
Source: U.S. Department of Housing and Urban Development
Release: New Residential Sales
Units:
Frequency:
Suggested Citation:
U.S. Census Bureau and U.S. Department of Housing and Urban Development, Average Sales Price of Houses Sold for the United States [ASPUS], retrieved from FRED, Federal Reserve Bank of St. Louis; https://fred.stlouisfed.org/series/ASPUS, .
Source: U.S. Census Bureau
Release: Income and Poverty in the United States
Units:
Frequency:
Notes:
Household data are collected as of March.
As stated in the Census's "Source and Accuracy of Estimates for Income, Poverty, and Health Insurance Coverage in the United States: 2011" (http://www.census.gov/hhes/www/p60_243sa.pdf):
Estimation of Median Incomes. The Census Bureau has changed the methodology for computing median income over time. The Census Bureau has computed medians using either Pareto interpolation or linear interpolation. Currently, we are using linear interpolation to estimate all medians. Pareto interpolation assumes a decreasing density of population within an income interval, whereas linear interpolation assumes a constant density of population within an income interval. The Census Bureau calculated estimates of median income and associated standard errors for 1979 through 1987 using Pareto interpolation if the estimate was larger than $20,000 for people or $40,000 for families and households. This is because the width of the income interval containing the estimate is greater than $2,500.
We calculated estimates of median income and associated standard errors for 1976, 1977, and 1978 using Pareto interpolation if the estimate was larger than $12,000 for people or $18,000 for families and households. This is because the width of the income interval containing the estimate is greater than $1,000. All other estimates of median income and associated standard errors for 1976 through 2011 (2012 ASEC) and almost all of the estimates of median income and associated standard errors for 1975 and earlier were calculated using linear interpolation.
Thus, use caution when comparing median incomes above $12,000 for people or $18,000 for families and households for different years. Median incomes below those levels are more comparable from year to year since they have always been calculated using linear interpolation. For an indication of the comparability of medians calculated using Pareto interpolation with medians calculated using linear interpolation, see Series P-60, Number 114, Money Income in 1976 of Families and Persons in the United States (www2.census.gov/prod2/popscan/p60-114.pdf).
Suggested Citation:
U.S. Census Bureau, Median Household Income in the United States [MEHOINUSA646N], retrieved from FRED, Federal Reserve Bank of St. Louis; https://fred.stlouisfed.org/series/MEHOINUSA646N, .
Release Tables
Income and Poverty in the United States
New Residential Sales
Related Data and Content
Data Suggestions Based On Your Search


Content Suggestions


Related Categories
M2 and Components
Monetary Data
Money, Banking, & Finance
New Residential Sales
Housing
Production & Business Activity
Income Distribution
Population, Employment, & Labor Markets
Releases
More
Series from H.6 Money Stock Measures
More
Series from New Residential Sales
More
Series from Income and Poverty in the United States
Tags
M2 Money Stock
H.6 Money Stock Measures
Monetary Aggregates
Weekly
Discontinued
Board of Governors
Seasonally Adjusted
Nation
Public Domain: Citation Requested
United States of America
New Residential Sales
Housing and Urban Development
Sales
Housing
Quarterly
Census
Not Seasonally Adjusted
Households
Income
Median
Annual