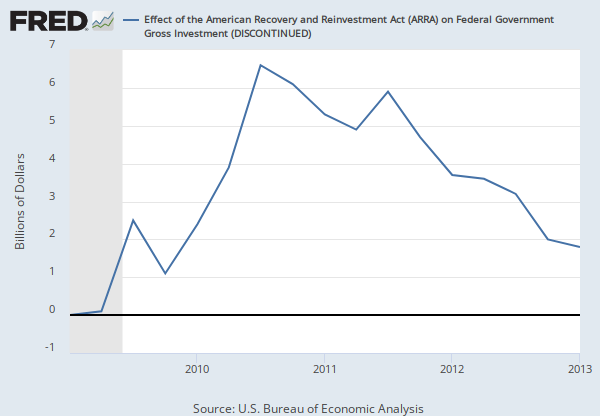
Observation:
Q1 2013: 4.2 (+ more) Updated: Aug 12, 2013 11:16 AM CDTQ1 2013: | 4.2 | |
Q4 2012: | 4.9 | |
Q3 2012: | 6.2 | |
Q2 2012: | 6.6 | |
Q1 2012: | 7.2 | |
View All |
Units:
Billions of Dollars,Frequency:
QuarterlyData in this graph are copyrighted. Please review the copyright information in the series notes before sharing.
Source: U.S. Bureau of Economic Analysis
Release: Federal Recovery Programs and BEA Statistics
Units: Billions of Dollars, Seasonally Adjusted Annual Rate
Frequency: Quarterly
The estimated effect of ARRA on selected NIPA estimates of federal receipts and expenditures.
Estimates of the ARRA’s effects on the NIPAs will not be available for periods after the first quarter of 2013 due to the lack of availability of source data and the declining impact of the ARRA on the NIPAs. For more information about the ARRA, visit http://www.ed.gov/open/plan/recovery-gov.
U.S. Bureau of Economic Analysis, Effect of the American Recovery and Reinvestment Act (ARRA) on Federal Government Consumption Expenditures (DISCONTINUED) [CONEXPQ027SBEA], retrieved from FRED, Federal Reserve Bank of St. Louis; https://fred.stlouisfed.org/series/CONEXPQ027SBEA, .