Notes
Source: Board of Governors of the Federal Reserve System (US)
Release: Distributional Financial Accounts
Units:
Frequency:
Notes:
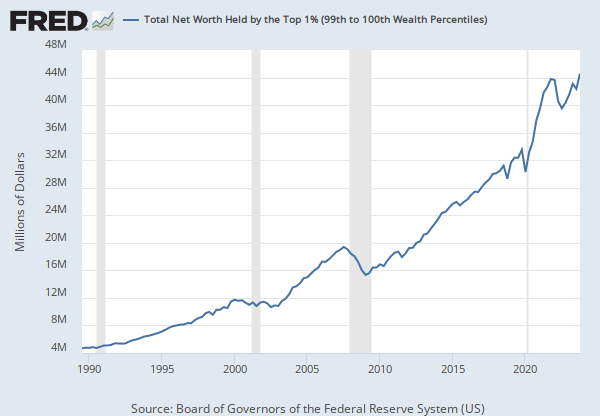
The Distributional Financial Accounts (DFAs) integrate two data products produced by the Federal Reserve Board: the Financial Accounts of the United States, which provide quarterly data on aggregate balance sheets of major sectors of the U.S. economy, and the Survey of Consumer Finances (SCF), which provides comprehensive triennial microdata on the assets and liabilities of a representative sample of U.S. households.
Information on the data collection process can be found at the Board of Governors."
Suggested Citation:
Board of Governors of the Federal Reserve System (US), Share of Net Worth Held by the Top 0.1% (99.9th to 100th Wealth Percentiles) [WFRBSTP1300], retrieved from FRED, Federal Reserve Bank of St. Louis; https://fred.stlouisfed.org/series/WFRBSTP1300, .
Source: Federal Reserve Bank of St. Louis
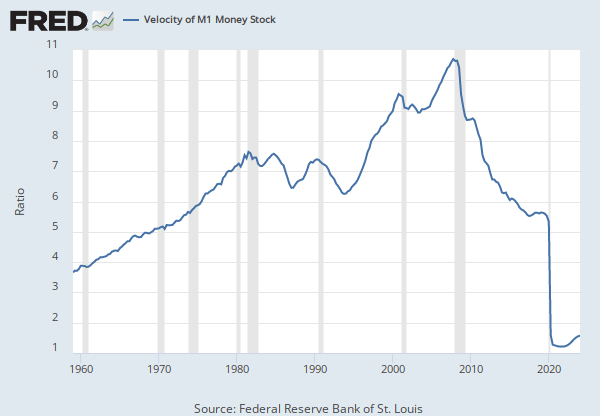
Release: Money Velocity
Units:
Frequency:
Notes:
Calculated as the ratio of quarterly nominal GDP to the quarterly average of M2 money stock.
The velocity of money is the frequency at which one unit of currency is used to purchase domestically- produced goods and services within a given time period. In other words, it is the number of times one dollar is spent to buy goods and services per unit of time. If the velocity of money is increasing, then more transactions are occurring between individuals in an economy.
The frequency of currency exchange can be used to determine the velocity of a given component of the money supply, providing some insight into whether consumers and businesses are saving or spending their money. There are several components of the money supply,: M1, M2, and MZM (M3 is no longer tracked by the Federal Reserve); these components are arranged on a spectrum of narrowest to broadest. Consider M1, the narrowest component. M1 is the money supply of currency in circulation (notes and coins, traveler's checks [non-bank issuers], demand deposits, and checkable deposits). A decreasing velocity of M1 might indicate fewer short- term consumption transactions are taking place. We can think of shorter- term transactions as consumption we might make on an everyday basis.
Beginning May 2020, M2 consists of M1 plus (1) small-denomination time deposits (time deposits in amounts of less than $100,000) less IRA and Keogh balances at depository institutions; and (2) balances in retail MMFs less IRA and Keogh balances at MMFs. Seasonally adjusted M2 is constructed by summing savings deposits (before May 2020), small-denomination time deposits, and retail MMFs, each seasonally adjusted separately, and adding this result to seasonally adjusted M1. For more information on the H.6 release changes and the regulatory amendment that led to the creation of the other liquid deposits component and its inclusion in the M1 monetary aggregate, see the H.6 announcements and Technical Q&As posted on December 17, 2020.
MZM (money with zero maturity) is the broadest component and consists of the supply of financial assets redeemable at par on demand: notes and coins in circulation, traveler's checks (non-bank issuers), demand deposits, other checkable deposits, savings deposits, and all money market funds. The velocity of MZM helps determine how often financial assets are switching hands within the economy.
Suggested Citation:
Federal Reserve Bank of St. Louis, Velocity of M2 Money Stock [M2V], retrieved from FRED, Federal Reserve Bank of St. Louis; https://fred.stlouisfed.org/series/M2V, .
Source: Board of Governors of the Federal Reserve System (US)
Release: Distributional Financial Accounts
Units:
Frequency:
Notes:
The Distributional Financial Accounts (DFAs) integrate two data products produced by the Federal Reserve Board: the Financial Accounts of the United States, which provide quarterly data on aggregate balance sheets of major sectors of the U.S. economy, and the Survey of Consumer Finances (SCF), which provides comprehensive triennial microdata on the assets and liabilities of a representative sample of U.S. households.
Information on the data collection process can be found at the Board of Governors."
Suggested Citation:
Board of Governors of the Federal Reserve System (US), Share of Net Worth Held by the 90th to 99th Wealth Percentiles [WFRBSN09161], retrieved from FRED, Federal Reserve Bank of St. Louis; https://fred.stlouisfed.org/series/WFRBSN09161, .
Source: Board of Governors of the Federal Reserve System (US)
Release: Distributional Financial Accounts
Units:
Frequency:
Notes:
The Distributional Financial Accounts (DFAs) integrate two data products produced by the Federal Reserve Board: the Financial Accounts of the United States, which provide quarterly data on aggregate balance sheets of major sectors of the U.S. economy, and the Survey of Consumer Finances (SCF), which provides comprehensive triennial microdata on the assets and liabilities of a representative sample of U.S. households.
Information on the data collection process can be found at the Board of Governors."
Suggested Citation:
Board of Governors of the Federal Reserve System (US), Share of Net Worth Held by the 50th to 90th Wealth Percentiles [WFRBSN40188], retrieved from FRED, Federal Reserve Bank of St. Louis; https://fred.stlouisfed.org/series/WFRBSN40188, .
Source: Board of Governors of the Federal Reserve System (US)
Release: Distributional Financial Accounts
Units:
Frequency:
Notes:
The Distributional Financial Accounts (DFAs) integrate two data products produced by the Federal Reserve Board: the Financial Accounts of the United States, which provide quarterly data on aggregate balance sheets of major sectors of the U.S. economy, and the Survey of Consumer Finances (SCF), which provides comprehensive triennial microdata on the assets and liabilities of a representative sample of U.S. households.
Information on the data collection process can be found at the Board of Governors."
Suggested Citation:
Board of Governors of the Federal Reserve System (US), Share of Net Worth Held by the Bottom 50% (1st to 50th Wealth Percentiles) [WFRBSB50215], retrieved from FRED, Federal Reserve Bank of St. Louis; https://fred.stlouisfed.org/series/WFRBSB50215, .
Source: U.S. Bureau of Labor Statistics
Release: Consumer Price Index
Units:
Frequency:
Notes:
The "Consumer Price Index for All Urban Consumers: All Items Less Food & Energy" is an aggregate of prices paid by urban consumers for a typical basket of goods, excluding food and energy. This measurement, known as "Core CPI," is widely used by economists because food and energy have very volatile prices. The Bureau of Labor Statistics defines and measures the official CPI, and more information can be found in the FAQ or in this article.
Suggested Citation:
U.S. Bureau of Labor Statistics, Consumer Price Index for All Urban Consumers: All Items Less Food and Energy in U.S. City Average [CPILFESL], retrieved from FRED, Federal Reserve Bank of St. Louis; https://fred.stlouisfed.org/series/CPILFESL, .
Release Tables
Consumer Price Index
Distributional Financial Accounts
Related Data and Content
Data Suggestions Based On Your Search


Content Suggestions


Other Formats
Related Categories
Income Distribution
Population, Employment, & Labor Markets
Money Velocity
Monetary Data
Money, Banking, & Finance
Special Indexes
Consumer Price Indexes (CPI and PCE)
Prices
Releases
More
Series from Distributional Financial Accounts
More
Series from Money Velocity
More
Series from Consumer Price Index
Tags
Shares
Net Worth
Wealth
Percentile
Net
Board of Governors
Quarterly
Nation
Public Domain: Citation Requested
United States of America
Not Seasonally Adjusted
Velocity
M2 Money Stock
Monetary Aggregates
St. Louis Fed
Seasonally Adjusted
Copyrighted: Citation Required
Core Inflation
Headline Figure
All Items
Urban
Consumer
Consumer Price Index
Inflation
Price Index
Indexes
Price
Bureau of Labor Statistics
Monthly