Notes
Source: U.S. Bureau of Economic Analysis
Release: Gross Domestic Product
Units:
Frequency:
Notes:
BEA Account Code: DPCERD
For more information about this series, please see http://www.bea.gov/national/.
Suggested Citation:
U.S. Bureau of Economic Analysis, Personal consumption expenditures (implicit price deflator) [DPCERD3Q086SBEA], retrieved from FRED, Federal Reserve Bank of St. Louis; https://fred.stlouisfed.org/series/DPCERD3Q086SBEA, .
Source: U.S. Bureau of Labor Statistics
Release: Consumer Expenditure Surveys
Units:
Frequency:
Notes:
For each time period represented in the tables, complete income reporters are ranked in ascending order, according to the level of total before-tax income reported by the consumer unit. The ranking is then divided into five equal groups. Incomplete income reporters are not ranked and are shown separately.
For more details about the data or the survey, visit the FAQs.
Suggested Citation:
U.S. Bureau of Labor Statistics, Income After Taxes: Income After Taxes by Quintiles of Income Before Taxes: Fourth 20 Percent (61st to 80th Percentile) [CXUINCAFTTXLB0105M], retrieved from FRED, Federal Reserve Bank of St. Louis; https://fred.stlouisfed.org/series/CXUINCAFTTXLB0105M, .
Source: U.S. Bureau of Labor Statistics
Release: Consumer Expenditure Surveys
Units:
Frequency:
Notes:
For each time period represented in the tables, complete income reporters are ranked in ascending order, according to the level of total before-tax income reported by the consumer unit. The ranking is then divided into five equal groups. Incomplete income reporters are not ranked and are shown separately.
For more details about the data or the survey, visit the FAQs.
Suggested Citation:
U.S. Bureau of Labor Statistics, Income After Taxes: Income After Taxes by Quintiles of Income Before Taxes: Highest 20 Percent (81st to 100th Percentile) [CXUINCAFTTXLB0106M], retrieved from FRED, Federal Reserve Bank of St. Louis; https://fred.stlouisfed.org/series/CXUINCAFTTXLB0106M, .
Source: U.S. Bureau of Economic Analysis
Release: Personal Income and Outlays
Units:
Frequency:
Notes:
BEA Account Code: DPCCRG
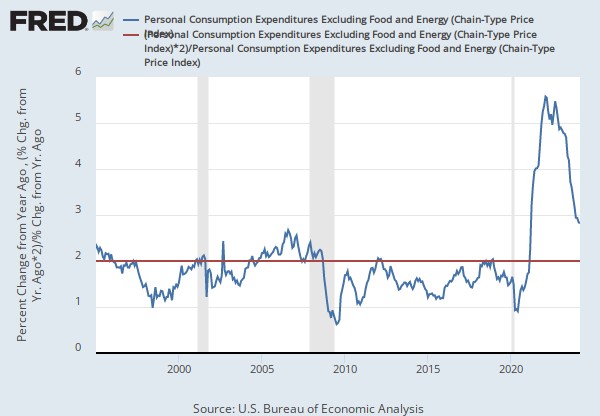
The Personal Consumption Expenditures Price Index is a measure of the prices that people living in the United States, or those buying on their behalf, pay for goods and services. The change in the PCE price index is known for capturing inflation (or deflation) across a wide range of consumer expenses and reflecting changes in consumer behavior. For example, if car prices rise, car sales may decline while bicycle sales increase.
The PCE Price Index is produced by the Bureau of Economic Analysis (BEA), which revises previously published PCE data to reflect updated information or new methodology, providing consistency across decades of data that's valuable for researchers. They also offer the series as a Chain-Type index and excluding food and energy products, as above. The PCE price index less food excluding food and energy is used primarily for macroeconomic analysis and forecasting future values of the PCE price index.
The PCE Price Index is similar to the Bureau of Labor Statistics' consumer price index for urban consumers. The two indexes, which have their own purposes and uses, are constructed differently, resulting in different inflation rates.
For more information on the PCE price index, see:
U.S. Bureau of Economic Analysis, Guide to the National Income and Product Accounts of the United States (NIPA)
U.S. Bureau of Economic Analysis, Personal Consumption Expenditures Price Index
U.S. Bureau of Economic Analysis, Prices & Inflation
U.S. Bureau of Labor Statistics, Differences between the Consumer Price Index and the Personal Consumption Expenditure Price Index
Suggested Citation:
U.S. Bureau of Economic Analysis, Personal Consumption Expenditures Excluding Food and Energy (Chain-Type Price Index) [PCEPILFE], retrieved from FRED, Federal Reserve Bank of St. Louis; https://fred.stlouisfed.org/series/PCEPILFE, .
Release Tables
Consumer Expenditure Surveys
- Fourth 20 Percent (61st to 80th Percentile): Income and Taxes
- Highest 20 Percent (81st to 100th Percentile): Income and Taxes
Gross Domestic Product
Personal Income and Outlays
Related Data and Content
Data Suggestions Based On Your Search


Content Suggestions


Other Formats
Personal consumption expenditures (implicit price deflator)
Annual, Not Seasonally AdjustedPersonal Consumption Expenditures Excluding Food and Energy (Chain-Type Price Index)
Percent Change from Quarter One Year Ago, Quarterly, Seasonally AdjustedRelated Categories
Price Indexes & Deflators
National Income & Product Accounts
National Accounts
Consumer Expenditures
Expenditures
Production & Business Activity
Consumer Price Indexes (CPI and PCE)
Prices
Releases
More
Series from Gross Domestic Product
More
Series from Consumer Expenditure Surveys
More
Series from Personal Income and Outlays
Tags
Implicit Price Deflator
Personal Consumption Expenditures
Consumption Expenditures
Consumption
Personal
National Income and Product Accounts
Bureau of Economic Analysis
Gross Domestic Product
Quarterly
Seasonally Adjusted
Nation
Public Domain: Citation Requested
United States of America
Percentile
Consumer Expenditure Surveys
Tax
Income
Bureau of Labor Statistics
Annual
Not Seasonally Adjusted
Core Inflation
Chained
Headline Figure
Energy
Inflation
Price Index
Indexes
Price
Monthly