Notes
Source: Lewis, Daniel J.
Source: Mertens, Karel
Source: Stock, James H.
Release: Weekly Economic Index (Lewis-Mertens-Stock)
Units:
Frequency:
Notes:
The WEI is an index of real economic activity using timely and relevant high-frequency data. It represents the common component of ten different daily and weekly series covering consumer behavior, the labor market, and production. The WEI is scaled to the four-quarter GDP growth rate; for example, if the WEI reads -2 percent and the current level of the WEI persists for an entire quarter, one would expect, on average, GDP that quarter to be 2 percent lower than a year previously.
The WEI is a composite of 10 weekly economic indicators: Redbook same-store sales, Rasmussen Consumer Index, new claims for unemployment insurance, continued claims for unemployment insurance, adjusted income/employment tax withholdings (from Booth Financial Consulting), railroad traffic originated (from the Association of American Railroads), the American Staffing Association Staffing Index, steel production, wholesale sales of gasoline, diesel, and jet fuel, and weekly average US electricity load (with remaining data supplied by Haver Analytics). All series are represented as year-over-year percentage changes. These series are combined into a single index of weekly economic activity.
For additional details, including an analysis of the performance of the model, see Lewis, Mertens, and Stock (2020), “U.S. Economic Activity during the Early Weeks of the SARS-Cov-2 Outbreak.”
This index has been developed by Daniel Lewis, an economist in the Federal Reserve Bank of New York, Karel Mertens, a senior economic policy advisor at the Federal Reserve Bank of Dallas, and James Stock, the Harold Hitchings Burbank Professor of Political Economy, Faculty of Arts and Sciences of Harvard University.
The index is not an official forecast of the Federal Reserve Bank of New York, its president, the Federal Reserve System, or the Federal Open Market Committee.
Suggested Citation:
Lewis, Daniel J., Mertens, Karel and Stock, James H., Weekly Economic Index (Lewis-Mertens-Stock) [WEI], retrieved from FRED, Federal Reserve Bank of St. Louis; https://fred.stlouisfed.org/series/WEI, .
Source: Federal Reserve Bank of St. Louis
Release: Interest Rate Spreads
Units:
Frequency:
Notes:
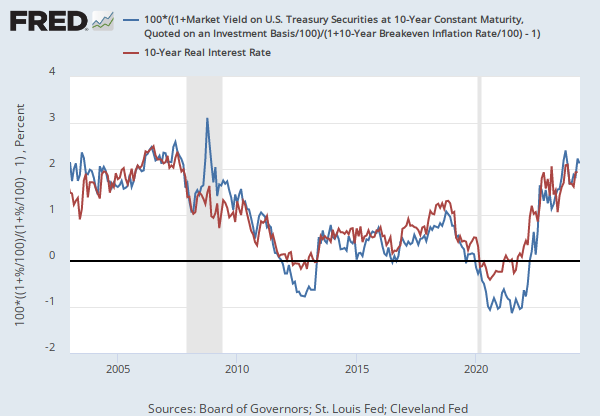
The breakeven inflation rate represents a measure of expected inflation derived from 10-Year Treasury Constant Maturity Securities (DGS10) and 10-Year Treasury Inflation-Indexed Constant Maturity Securities (DFII10). The latest value implies what market participants expect inflation to be in the next 10 years, on average.
Starting with the update on June 21, 2019, the Treasury bond data used in calculating interest rate spreads is obtained directly from the U.S. Treasury Department.
Suggested Citation:
Federal Reserve Bank of St. Louis, 10-Year Breakeven Inflation Rate [T10YIE], retrieved from FRED, Federal Reserve Bank of St. Louis; https://fred.stlouisfed.org/series/T10YIE, .
Related Data and Content
Data Suggestions Based On Your Search


Content Suggestions


Other Formats
Related Categories
GDP/GNP
National Income & Product Accounts
National Accounts
Interest Rate Spreads
Interest Rates
Money, Banking, & Finance