Federal Reserve Economic Data
Data in this graph are copyrighted. Please review the copyright information in the series notes before sharing.
Notes
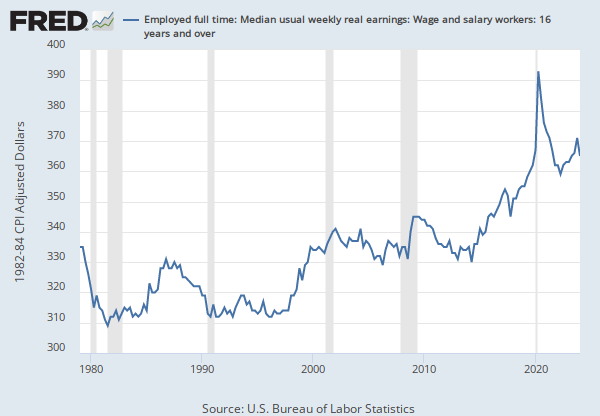
Source: U.S. Bureau of Labor Statistics
Release: Weekly and Hourly Earnings from the Current Population Survey
Units: 1982-84 CPI Adjusted Dollars, Seasonally Adjusted
Frequency: Quarterly
Notes:
Data measure usual weekly earnings of wage and salary workers. Wage and salary workers are workers who receive wages, salaries, commissions, tips, payment in kind, or piece rates. The group includes employees in both the private and public sectors but, for the purposes of the earnings series, it excludes all self-employed persons, both those with incorporated businesses and those with unincorporated businesses.
Usual weekly earnings represent earnings before taxes and other deductions and include any overtime pay, commissions, or tips usually received (at the main job in the case of multiple jobholders). Prior to 1994, respondents were asked how much they usually earned per week. Since January 1994, respondents have been asked to identify the easiest way for them to report earnings (hourly, weekly, biweekly, twice monthly, monthly, annually, or other) and how much they usually earn in the reported time period. Earnings reported on a basis other than weekly are converted to a weekly equivalent. The term "usual" is determined by each respondent's own understanding of the term. If the respondent asks for a definition of "usual," interviewers are instructed to define the term as more than half the weeks worked during the past 4 or 5 months. Visit the BLS for more information.
The series comes from the 'Current Population Survey (Household Survey)'
The source code is: LES1252881600
Suggested Citation:
U.S. Bureau of Labor Statistics, Employed full time: Median usual weekly real earnings: Wage and salary workers: 16 years and over [LES1252881600Q], retrieved from FRED, Federal Reserve Bank of St. Louis; https://fred.stlouisfed.org/series/LES1252881600Q, .
Source: U.S. Bureau of Labor Statistics
Release: Productivity and Costs
Units: Index 2017=100, Seasonally Adjusted
Frequency: Quarterly
Notes:
The Productivity and Costs release on August 7, 2003,
will reflect the June 2003 benchmark revision to payroll
employment. Since employment is now reported on
a North American Industry Classification System (NAICS) basis,
all of the historical data will be revised.
Changes as a consequence of the move to
NAICS should not be significant since this release
carries data at high levels of aggregation.
Suggested Citation:
U.S. Bureau of Labor Statistics, Nonfarm Business Sector: Real Hourly Compensation for All Workers [COMPRNFB], retrieved from FRED, Federal Reserve Bank of St. Louis; https://fred.stlouisfed.org/series/COMPRNFB, .
Source: U.S. Bureau of Labor Statistics
Release: Employment Situation
Units: Dollars per Hour, Seasonally Adjusted
Frequency: Monthly
Notes:
The series comes from the 'Current Employment Statistics (Establishment Survey).'
The source code is: CES0500000003
The Average Hourly Earnings of All Private Employees is a measure of the average hourly earnings of all private employees on a “gross” basis, including premium pay for overtime and late-shift work. These differ from wage rates in that average hourly earnings measure the actual return to a worker for a set period of time, rather than the amount contracted for a unit of work, the wage rate. This measure excludes benefits, irregular bonuses, retroactive pay, and payroll taxes paid by the employer.
Average Hourly Earnings are collected in the Current Employment Statistics (CES) program and published by the BLS. It is provided on a monthly basis, so this data is used in part by macroeconomists as an initial economic indicator of current trends. Progressions in earnings specifically help policy makers understand some of the pressures driving inflation.
It is important to note that this series measures the average hourly earnings of the pool of workers in each period. Thus, changes in average hourly earnings can be due to either changes in the set of workers observed in a given period, or due to changes in earnings. For instance, in recessions that lead to the disproportionate increase of unemployment in lower-wage jobs, average hourly earnings can increase due to changes in the pool of workers rather than due to the widespread increase of hourly earnings at the worker-level.
For more information, see:
U.S. Bureau of Labor Statistics, CES Overview
U.S. Bureau of Labor Statistics, BLS Handbook of Methods: Chapter 2. Employment, Hours, and Earnings from the Establishment Survey
Suggested Citation:
U.S. Bureau of Labor Statistics, Average Hourly Earnings of All Employees, Total Private [CES0500000003], retrieved from FRED, Federal Reserve Bank of St. Louis; https://fred.stlouisfed.org/series/CES0500000003, .
Source: U.S. Bureau of Economic Analysis
Release: Personal Income and Outlays
Units: Index 2017=100, Seasonally Adjusted
Frequency: Monthly
Notes:
BEA Account Code: DPCERG
The Personal Consumption Expenditures Price Index is a measure of the prices that people living in the United States, or those buying on their behalf, pay for goods and services. The change in the PCE price index is known for capturing inflation (or deflation) across a wide range of consumer expenses and reflecting changes in consumer behavior. For example, if the price of beef rises, shoppers may buy less beef and more chicken.
The PCE Price Index is produced by the Bureau of Economic Analysis (BEA), which revises previously published PCE data to reflect updated information or new methodology, providing consistency across decades of data that's valuable for researchers. They also offer the series as a Chain-Type index, as above. The PCE price index is used primarily for macroeconomic analysis and forecasting.
The PCE Price index is the Federal Reserve’s preferred measure of inflation. The PCE Price Index is similar to the Bureau of Labor Statistics' consumer price index for urban consumers. The two indexes, which have their own purposes and uses, are constructed differently, resulting in different inflation rates.
For more information on the PCE price index, see:
U.S. Bureau of Economic Analysis, Guide to the National Income and Product Accounts of the United States (NIPA)
U.S. Bureau of Economic Analysis, Personal Consumption Expenditures Price Index
U.S. Bureau of Economic Analysis, Prices & Inflation
U.S. Bureau of Labor Statistics, Differences between the Consumer Price Index and the Personal Consumption Expenditure Price Index
Suggested Citation:
U.S. Bureau of Economic Analysis, Personal Consumption Expenditures: Chain-type Price Index [PCEPI], retrieved from FRED, Federal Reserve Bank of St. Louis; https://fred.stlouisfed.org/series/PCEPI, .
Release Tables
Related Data and Content
Data Suggestions Based On Your Search
Content Suggestions
Other Formats
Employed full time: Median usual weekly real earnings: Wage and salary workers: 16 years and over
Annual, Not Seasonally Adjusted Quarterly, Not Seasonally AdjustedNonfarm Business Sector: Real Hourly Compensation for All Workers
Percent Change at Annual Rate, Quarterly, Seasonally Adjusted Percent Change from Quarter One Year Ago, Quarterly, Seasonally AdjustedAverage Hourly Earnings of All Employees, Total Private
Monthly, Not Seasonally AdjustedPersonal Consumption Expenditures: Chain-type Price Index
Annual, Not Seasonally Adjusted Quarterly, Seasonally AdjustedRelated Categories
Releases
Tags
Permalink/Embed
modal open, choose link customization options
Select automatic updates to the data or a static time frame. All data are subject to revision.


