FRED Graph

Your trusted data source
since 1991.
Source: Board of Governors of the Federal Reserve System (US)
Release: H.15 Selected Interest Rates
Units:
Frequency:
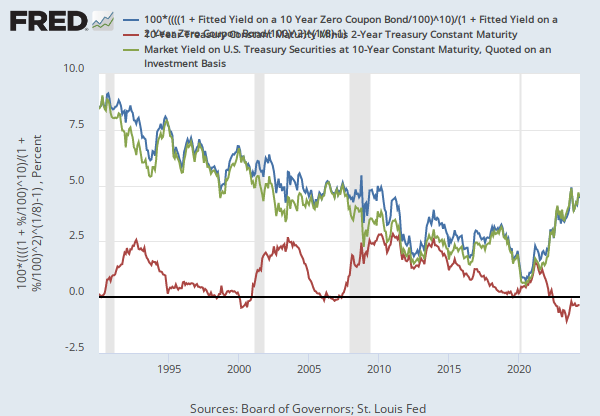
For further information regarding treasury constant maturity data, please refer to the H.15 Statistical Release notes and the Treasury Yield Curve Methodology.
Board of Governors of the Federal Reserve System (US), Market Yield on U.S. Treasury Securities at 10-Year Constant Maturity, Quoted on an Investment Basis, Inflation-Indexed [DFII10], retrieved from FRED, Federal Reserve Bank of St. Louis; https://fred.stlouisfed.org/series/DFII10, June 1, 2024.
Source: Board of Governors of the Federal Reserve System (US)
Release: H.15 Selected Interest Rates
Units:
Frequency:
For further information regarding treasury constant maturity data, please refer to the H.15 Statistical Release notes and Treasury Yield Curve Methodology.
Board of Governors of the Federal Reserve System (US), Market Yield on U.S. Treasury Securities at 10-Year Constant Maturity, Quoted on an Investment Basis [DGS10], retrieved from FRED, Federal Reserve Bank of St. Louis; https://fred.stlouisfed.org/series/DGS10, June 1, 2024.
Source: Chicago Board Options Exchange
Release: CBOE Market Statistics
Units:
Frequency:
VIX measures market expectation of near term volatility conveyed by stock index option prices. Copyright, 2016, Chicago Board Options Exchange, Inc. Reprinted with permission.
Chicago Board Options Exchange, CBOE Volatility Index: VIX [VIXCLS], retrieved from FRED, Federal Reserve Bank of St. Louis; https://fred.stlouisfed.org/series/VIXCLS, June 1, 2024.
Source: Federal Reserve Bank of St. Louis
Release: St. Louis Fed Financial Stress Index
Units:
Frequency:
The methodology for the St. Louis Fed's Financial Stress Index was revised and this series is discontinued. The new version, STLFSI3, can be found here.
The STLFSI measures the degree of financial stress in the markets and is constructed from 18 weekly data series: seven interest rate series, six yield spreads and five other indicators. Each of these variables captures some aspect of financial stress. Accordingly, as the level of financial stress in the economy changes, the data series are likely to move together.
How to Interpret the Index:
The average value of the index, which begins in late 1993, is designed to be zero. Thus, zero is viewed as representing normal financial market conditions. Values below zero suggest below-average financial market stress, while values above zero suggest above-average financial market stress.
More information:
For additional information on the STLFSI and its construction, see "Measuring Financial Market Stress" and the related appendix.
See this list of the components that are used to construct the STLFSI.
As of 07/15/2010 the Vanguard Financial Exchange-Traded Fund series has been replaced with the S&P 500 Financials Index. This change was made to facilitate a more timely and automated updating of the FSI. Switching from the Vanguard series to the S&P series produced no meaningful change in the index.
Copyright, 2016, Federal Reserve Bank of St. Louis.
Federal Reserve Bank of St. Louis, St. Louis Fed Financial Stress Index (DISCONTINUED) [STLFSI], retrieved from FRED, Federal Reserve Bank of St. Louis; https://fred.stlouisfed.org/series/STLFSI, June 1, 2024.
Source: S&P Dow Jones Indices LLC
Release: Standard & Poors
Units:
Frequency:
The observations for the S&P 500 represent the daily index value at market close. The market typically closes at 4 PM ET, except for holidays when it sometimes closes early.
The Federal Reserve Bank of St. Louis and S&P Dow Jones Indices LLC have reached a new agreement on the use of Standard & Poors and Dow Jones Averages series in FRED. FRED and its associated services will include 10 years of daily history for Standard & Poors and Dow Jones Averages series.
The S&P 500 is regarded as a gauge of the large cap U.S. equities market. The index includes 500 leading companies in leading industries of the U.S. economy, which are publicly held on either the NYSE or NASDAQ, and covers 75% of U.S. equities. Since this is a price index and not a total return index, the S&P 500 index here does not contain dividends.
Copyright © 2016, S&P Dow Jones Indices LLC. All rights reserved. Reproduction of S&P 500 in any form is prohibited except with the prior written permission of S&P Dow Jones Indices LLC ("S&P"). S&P does not guarantee the accuracy, adequacy, completeness or availability of any information and is not responsible for any errors or omissions, regardless of the cause or for the results obtained from the use of such information. S&P DISCLAIMS ANY AND ALL EXPRESS OR IMPLIED WARRANTIES, INCLUDING, BUT NOT LIMITED TO, ANY WARRANTIES OF MERCHANTABILITY OR FITNESS FOR A PARTICULAR PURPOSE OR USE. In no event shall S&P be liable for any direct, indirect, special or consequential damages, costs, expenses, legal fees, or losses (including lost income or lost profit and opportunity costs) in connection with subscriber's or others' use of S&P 500.
Permission to reproduce S&P 500 can be requested from index_services@spdji.com. More contact details are available here, including phone numbers for all regional offices.
S&P Dow Jones Indices LLC, S&P 500 [SP500], retrieved from FRED, Federal Reserve Bank of St. Louis; https://fred.stlouisfed.org/series/SP500, June 1, 2024.
Market Yield on U.S. Treasury Securities at 10-Year Constant Maturity, Quoted on an Investment Basis, Inflation-Indexed
Annual, Not Seasonally Adjusted Monthly, Not Seasonally Adjusted Weekly, Not Seasonally AdjustedMarket Yield on U.S. Treasury Securities at 10-Year Constant Maturity, Quoted on an Investment Basis
Annual, Not Seasonally Adjusted Monthly, Not Seasonally Adjusted Weekly, Not Seasonally AdjustedSt. Louis Fed Financial Stress Index (DISCONTINUED)
Weekly, Not Seasonally Adjusted Weekly, Not Seasonally Adjusted