Notes
Source: S&P Dow Jones Indices LLC
Release: S&P Cotality Case-Shiller Home Price Indices
Units:
Frequency:
Notes:
For more information regarding the index, please visit Standard & Poor's.
Copyright © 2016, S&P Dow Jones Indices LLC. All rights reserved. Reproduction of Home Price Index for Chicago, Illinois in any form is prohibited except with the prior written permission of S&P Dow Jones Indices LLC "S&P". S&P does not guarantee the accuracy, adequacy, completeness or availability of any information and is not responsible for any errors or omissions, regardless of the cause or for the results obtained from the use of such information. S&P DISCLAIMS ANY AND ALL EXPRESS OR IMPLIED WARRANTIES, INCLUDING, BUT NOT LIMITED TO, ANY WARRANTIES OF MERCHANTABILITY OR FITNESS FOR A PARTICULAR PURPOSE OR USE. In no event shall S&P be liable for any direct, indirect, special or consequential damages, costs, expenses, legal fees, or losses (including lost income or lost profit and opportunity costs) in connection with subscriber's or others' user of Home Price Index for Chicago, Illinois.
Permission to reproduce this series can be requested from index_services@spdji.com. More contact details are available from http://us.spindices.com/contact-us/, including phone numbers for all of its regional offices.
Suggested Citation:
S&P Dow Jones Indices LLC, S&P Cotality Case-Shiller IL-Chicago Home Price Index [CHXRSA], retrieved from FRED, Federal Reserve Bank of St. Louis; https://fred.stlouisfed.org/series/CHXRSA, .
Source: U.S. Bureau of Labor Statistics
Source: Federal Reserve Bank of St. Louis
Release: State and Metro Area Employment, Hours, and Earnings
Units:
Frequency:
Notes:
This series is discontinued and will no longer be updated. The Federal Reserve Bank of St. Louis previously calculated this seasonally adjusted (SA) series based on the not seasonally adjusted (NSA) version available here. However, most of the earnings-related series do not have a significant seasonal component, so the values for both the SA and the NSA series are very similar. See the NSA series for updated values.
The Federal Reserve Bank of St. Louis previously used to seasonally adjust this series by using the 'statsmodels' library from Python with default parameter settings. The package uses the U.S. Bureau of the Census X-13ARIMA-SEATS Seasonal Adjustment Program. More information on the 'statsmodels' X-13ARIMA-SEATS package can be found here. More information on X-13ARIMA-SEATS can be found here.
Many series include both seasonally adjusted (SA) and not seasonally adjusted (NSA) data. Occasionally, updates to the data will not include sufficient seasonal factors to trigger a seasonal adjustment. In these cases, the NSA series will be updated normally; but the SA series will also be updated with the NSA data. The NSA series can be located here here.
Some seasonally adjusted series may exhibit negative values because they are created from a seasonal adjustment process regardless of the actual meaning or interpretation of the given indicator.
Suggested Citation:
U.S. Bureau of Labor Statistics and Federal Reserve Bank of St. Louis, Average Weekly Earnings of All Employees: Total Private in Chicago-Naperville-Arlington Heights, IL (MD) (DISCONTINUED) [SMU17169740500000011SA], retrieved from FRED, Federal Reserve Bank of St. Louis; https://fred.stlouisfed.org/series/SMU17169740500000011SA, .
Source: S&P Dow Jones Indices LLC
Release: S&P Cotality Case-Shiller Home Price Indices
Units:
Frequency:
Notes:
For more information regarding the index, please visit Standard & Poor's.
Copyright © 2016, S&P Dow Jones Indices LLC. All rights reserved. Reproduction of Home Price Index for Seattle, Washington in any form is prohibited except with the prior written permission of S&P Dow Jones Indices LLC "S&P". S&P does not guarantee the accuracy, adequacy, completeness or availability of any information and is not responsible for any errors or omissions, regardless of the cause or for the results obtained from the use of such information. S&P DISCLAIMS ANY AND ALL EXPRESS OR IMPLIED WARRANTIES, INCLUDING, BUT NOT LIMITED TO, ANY WARRANTIES OF MERCHANTABILITY OR FITNESS FOR A PARTICULAR PURPOSE OR USE. In no event shall S&P be liable for any direct, indirect, special or consequential damages, costs, expenses, legal fees, or losses (including lost income or lost profit and opportunity costs) in connection with subscriber's or others' user of Home Price Index for Seattle, Washington.
Permission to reproduce this series can be requested from index_services@spdji.com. More contact details are available from http://us.spindices.com/contact-us/, including phone numbers for all of its regional offices.
Suggested Citation:
S&P Dow Jones Indices LLC, S&P Cotality Case-Shiller WA-Seattle Home Price Index [SEXRNSA], retrieved from FRED, Federal Reserve Bank of St. Louis; https://fred.stlouisfed.org/series/SEXRNSA, .
Source: U.S. Bureau of Labor Statistics
Source: Federal Reserve Bank of St. Louis
Release: State and Metro Area Employment, Hours, and Earnings
Units:
Frequency:
Suggested Citation:
U.S. Bureau of Labor Statistics and Federal Reserve Bank of St. Louis, Average Weekly Earnings of All Employees: Total Private in Seattle-Bellevue-Everett, WA (MD) [SMU53426440500000011A], retrieved from FRED, Federal Reserve Bank of St. Louis; https://fred.stlouisfed.org/series/SMU53426440500000011A, .
Source: S&P Dow Jones Indices LLC
Release: S&P Cotality Case-Shiller Home Price Indices
Units:
Frequency:
Notes:
For more information regarding the index, please visit Standard & Poor's.
Copyright © 2016, S&P Dow Jones Indices LLC. All rights reserved. Reproduction of Home Price Index for Dallas, Texas in any form is prohibited except with the prior written permission of S&P Dow Jones Indices LLC "S&P". S&P does not guarantee the accuracy, adequacy, completeness or availability of any information and is not responsible for any errors or omissions, regardless of the cause or for the results obtained from the use of such information. S&P DISCLAIMS ANY AND ALL EXPRESS OR IMPLIED WARRANTIES, INCLUDING, BUT NOT LIMITED TO, ANY WARRANTIES OF MERCHANTABILITY OR FITNESS FOR A PARTICULAR PURPOSE OR USE. In no event shall S&P be liable for any direct, indirect, special or consequential damages, costs, expenses, legal fees, or losses (including lost income or lost profit and opportunity costs) in connection with subscriber's or others' user of Home Price Index for Dallas, Texas.
Permission to reproduce this series can be requested from index_services@spdji.com. More contact details are available from http://us.spindices.com/contact-us/, including phone numbers for all of its regional offices.
Suggested Citation:
S&P Dow Jones Indices LLC, S&P Cotality Case-Shiller TX-Dallas Home Price Index [DAXRSA], retrieved from FRED, Federal Reserve Bank of St. Louis; https://fred.stlouisfed.org/series/DAXRSA, .
Source: U.S. Bureau of Labor Statistics
Source: Federal Reserve Bank of St. Louis
Release: State and Metro Area Employment, Hours, and Earnings
Units:
Frequency:
Notes:
This series is discontinued and will no longer be updated. The Federal Reserve Bank of St. Louis previously calculated this seasonally adjusted (SA) series based on the not seasonally adjusted (NSA) version available here. However, most of the earnings-related series do not have a significant seasonal component, so the values for both the SA and the NSA series are very similar. See the NSA series for updated values.
The Federal Reserve Bank of St. Louis previously used to seasonally adjust this series by using the 'statsmodels' library from Python with default parameter settings. The package uses the U.S. Bureau of the Census X-13ARIMA-SEATS Seasonal Adjustment Program. More information on the 'statsmodels' X-13ARIMA-SEATS package can be found here. More information on X-13ARIMA-SEATS can be found here.
Many series include both seasonally adjusted (SA) and not seasonally adjusted (NSA) data. Occasionally, updates to the data will not include sufficient seasonal factors to trigger a seasonal adjustment. In these cases, the NSA series will be updated normally; but the SA series will also be updated with the NSA data. The NSA series can be located here here.
Some seasonally adjusted series may exhibit negative values because they are created from a seasonal adjustment process regardless of the actual meaning or interpretation of the given indicator.
Suggested Citation:
U.S. Bureau of Labor Statistics and Federal Reserve Bank of St. Louis, Average Weekly Earnings of All Employees: Total Private in Dallas-Plano-Irving, TX (MD) (DISCONTINUED) [SMU48191240500000011SA], retrieved from FRED, Federal Reserve Bank of St. Louis; https://fred.stlouisfed.org/series/SMU48191240500000011SA, .
Source: S&P Dow Jones Indices LLC
Release: S&P Cotality Case-Shiller Home Price Indices
Units:
Frequency:
Notes:
For more information regarding the index, please visit Standard & Poor's.
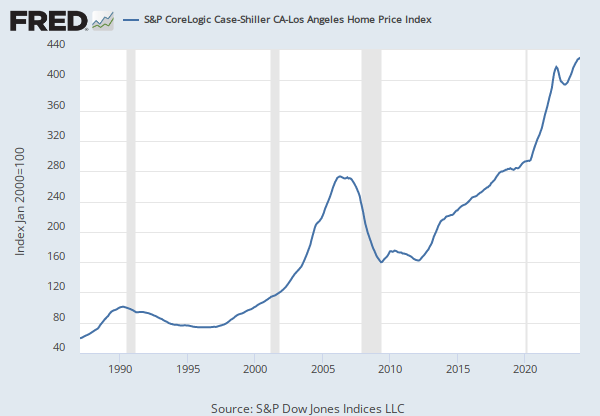
Copyright © 2016, S&P Dow Jones Indices LLC. All rights reserved. Reproduction of Home Price Index for Los Angeles, California in any form is prohibited except with the prior written permission of S&P Dow Jones Indices LLC "S&P". S&P does not guarantee the accuracy, adequacy, completeness or availability of any information and is not responsible for any errors or omissions, regardless of the cause or for the results obtained from the use of such information. S&P DISCLAIMS ANY AND ALL EXPRESS OR IMPLIED WARRANTIES, INCLUDING, BUT NOT LIMITED TO, ANY WARRANTIES OF MERCHANTABILITY OR FITNESS FOR A PARTICULAR PURPOSE OR USE. In no event shall S&P be liable for any direct, indirect, special or consequential damages, costs, expenses, legal fees, or losses (including lost income or lost profit and opportunity costs) in connection with subscriber's or others' user of Home Price Index for Los Angeles, California.
Permission to reproduce this series can be requested from index_services@spdji.com. More contact details are available from http://us.spindices.com/contact-us/, including phone numbers for all of its regional offices.
Suggested Citation:
S&P Dow Jones Indices LLC, S&P Cotality Case-Shiller CA-Los Angeles Home Price Index [LXXRSA], retrieved from FRED, Federal Reserve Bank of St. Louis; https://fred.stlouisfed.org/series/LXXRSA, .
Source: U.S. Bureau of Labor Statistics
Source: Federal Reserve Bank of St. Louis
Release: State and Metro Area Employment, Hours, and Earnings
Units:
Frequency:
Notes:
This series is discontinued and will no longer be updated. The Federal Reserve Bank of St. Louis previously calculated this seasonally adjusted (SA) series based on the not seasonally adjusted (NSA) version available here. However, most of the earnings-related series do not have a significant seasonal component, so the values for both the SA and the NSA series are very similar. See the NSA series for updated values.
The Federal Reserve Bank of St. Louis previously used to seasonally adjust this series by using the 'statsmodels' library from Python with default parameter settings. The package uses the U.S. Bureau of the Census X-13ARIMA-SEATS Seasonal Adjustment Program. More information on the 'statsmodels' X-13ARIMA-SEATS package can be found here. More information on X-13ARIMA-SEATS can be found here.
Many series include both seasonally adjusted (SA) and not seasonally adjusted (NSA) data. Occasionally, updates to the data will not include sufficient seasonal factors to trigger a seasonal adjustment. In these cases, the NSA series will be updated normally; but the SA series will also be updated with the NSA data. The NSA series can be located here here.
Some seasonally adjusted series may exhibit negative values because they are created from a seasonal adjustment process regardless of the actual meaning or interpretation of the given indicator.
Suggested Citation:
U.S. Bureau of Labor Statistics and Federal Reserve Bank of St. Louis, Average Weekly Earnings of All Employees: Total Private in Los Angeles-Long Beach-Glendale, CA (MD) (DISCONTINUED) [SMU06310840500000011SA], retrieved from FRED, Federal Reserve Bank of St. Louis; https://fred.stlouisfed.org/series/SMU06310840500000011SA, .
Source: S&P Dow Jones Indices LLC
Release: S&P Cotality Case-Shiller Home Price Indices
Units:
Frequency:
Notes:
For more information regarding the index, please visit Standard & Poor's.
Copyright © 2016, S&P Dow Jones Indices LLC. All rights reserved. Reproduction of Home Price Index for San Francisco, California in any form is prohibited except with the prior written permission of S&P Dow Jones Indices LLC "S&P". S&P does not guarantee the accuracy, adequacy, completeness or availability of any information and is not responsible for any errors or omissions, regardless of the cause or for the results obtained from the use of such information. S&P DISCLAIMS ANY AND ALL EXPRESS OR IMPLIED WARRANTIES, INCLUDING, BUT NOT LIMITED TO, ANY WARRANTIES OF MERCHANTABILITY OR FITNESS FOR A PARTICULAR PURPOSE OR USE. In no event shall S&P be liable for any direct, indirect, special or consequential damages, costs, expenses, legal fees, or losses (including lost income or lost profit and opportunity costs) in connection with subscriber's or others' user of Home Price Index for San Francisco, California.
Permission to reproduce this series can be requested from index_services@spdji.com. More contact details are available, including phone numbers for all regional offices.
Suggested Citation:
S&P Dow Jones Indices LLC, S&P Cotality Case-Shiller CA-San Francisco Home Price Index [SFXRSA], retrieved from FRED, Federal Reserve Bank of St. Louis; https://fred.stlouisfed.org/series/SFXRSA, .
Source: U.S. Bureau of Labor Statistics
Source: Federal Reserve Bank of St. Louis
Release: State and Metro Area Employment, Hours, and Earnings
Units:
Frequency:
Notes:
This series is discontinued and will no longer be updated. The Federal Reserve Bank of St. Louis previously calculated this seasonally adjusted (SA) series based on the not seasonally adjusted (NSA) version available here. However, most of the earnings-related series do not have a significant seasonal component, so the values for both the SA and the NSA series are very similar. See the NSA series for updated values.
The Federal Reserve Bank of St. Louis previously used to seasonally adjust this series by using the 'statsmodels' library from Python with default parameter settings. The package uses the U.S. Bureau of the Census X-13ARIMA-SEATS Seasonal Adjustment Program. More information on the 'statsmodels' X-13ARIMA-SEATS package can be found here. More information on X-13ARIMA-SEATS can be found here.
Many series include both seasonally adjusted (SA) and not seasonally adjusted (NSA) data. Occasionally, updates to the data will not include sufficient seasonal factors to trigger a seasonal adjustment. In these cases, the NSA series will be updated normally; but the SA series will also be updated with the NSA data. The NSA series can be located here here.
Some seasonally adjusted series may exhibit negative values because they are created from a seasonal adjustment process regardless of the actual meaning or interpretation of the given indicator.
Suggested Citation:
U.S. Bureau of Labor Statistics and Federal Reserve Bank of St. Louis, Average Weekly Earnings of All Employees: Total Private in San Francisco-Redwood City-South San Francisco, CA (MD) (DISCONTINUED) [SMU06418840500000011SA], retrieved from FRED, Federal Reserve Bank of St. Louis; https://fred.stlouisfed.org/series/SMU06418840500000011SA, .
Source: S&P Dow Jones Indices LLC
Release: S&P Cotality Case-Shiller Home Price Indices
Units:
Frequency:
Notes:
For more information regarding the index, please visit Standard & Poor's.
Copyright © 2016, S&P Dow Jones Indices LLC. All rights reserved. Reproduction of Home Price Index for Detroit, Michigan in any form is prohibited except with the prior written permission of S&P Dow Jones Indices LLC "S&P". S&P does not guarantee the accuracy, adequacy, completeness or availability of any information and is not responsible for any errors or omissions, regardless of the cause or for the results obtained from the use of such information. S&P DISCLAIMS ANY AND ALL EXPRESS OR IMPLIED WARRANTIES, INCLUDING, BUT NOT LIMITED TO, ANY WARRANTIES OF MERCHANTABILITY OR FITNESS FOR A PARTICULAR PURPOSE OR USE. In no event shall S&P be liable for any direct, indirect, special or consequential damages, costs, expenses, legal fees, or losses (including lost income or lost profit and opportunity costs) in connection with subscriber's or others' user of Home Price Index for Detroit, Michigan.
Permission to reproduce this series can be requested from index_services@spdji.com. More contact details are available from http://us.spindices.com/contact-us/, including phone numbers for all of its regional offices.
Suggested Citation:
S&P Dow Jones Indices LLC, S&P Cotality Case-Shiller MI-Detroit Home Price Index [DEXRSA], retrieved from FRED, Federal Reserve Bank of St. Louis; https://fred.stlouisfed.org/series/DEXRSA, .
Source: U.S. Bureau of Labor Statistics
Source: Federal Reserve Bank of St. Louis
Release: State and Metro Area Employment, Hours, and Earnings
Units:
Frequency:
Notes:
This series is discontinued and will no longer be updated. The Federal Reserve Bank of St. Louis previously calculated this seasonally adjusted (SA) series based on the not seasonally adjusted (NSA) version available here. However, most of the earnings-related series do not have a significant seasonal component, so the values for both the SA and the NSA series are very similar. See the NSA series for updated values.
The Federal Reserve Bank of St. Louis previously used to seasonally adjust this series by using the 'statsmodels' library from Python with default parameter settings. The package uses the U.S. Bureau of the Census X-13ARIMA-SEATS Seasonal Adjustment Program. More information on the 'statsmodels' X-13ARIMA-SEATS package can be found here. More information on X-13ARIMA-SEATS can be found here.
Many series include both seasonally adjusted (SA) and not seasonally adjusted (NSA) data. Occasionally, updates to the data will not include sufficient seasonal factors to trigger a seasonal adjustment. In these cases, the NSA series will be updated normally; but the SA series will also be updated with the NSA data. The NSA series can be located here here.
Some seasonally adjusted series may exhibit negative values because they are created from a seasonal adjustment process regardless of the actual meaning or interpretation of the given indicator.
Suggested Citation:
U.S. Bureau of Labor Statistics and Federal Reserve Bank of St. Louis, Average Weekly Earnings of All Employees: Total Private in Detroit-Dearborn-Livonia, MI (MD) (DISCONTINUED) [SMU26198040500000011SA], retrieved from FRED, Federal Reserve Bank of St. Louis; https://fred.stlouisfed.org/series/SMU26198040500000011SA, .
Release Tables
S&P Cotality Case-Shiller Home Price Indices
Related Data and Content
Data Suggestions Based On Your Search


Content Suggestions


Other Formats
S&P Cotality Case-Shiller IL-Chicago Home Price Index
Monthly, Not Seasonally AdjustedAverage Weekly Earnings of All Employees: Total Private in Chicago-Naperville-Arlington Heights, IL (MD) (DISCONTINUED)
Annual, Not Seasonally AdjustedS&P Cotality Case-Shiller WA-Seattle Home Price Index
Monthly, Seasonally AdjustedS&P Cotality Case-Shiller TX-Dallas Home Price Index
Monthly, Not Seasonally AdjustedS&P Cotality Case-Shiller CA-Los Angeles Home Price Index
Monthly, Not Seasonally AdjustedS&P Cotality Case-Shiller CA-San Francisco Home Price Index
Monthly, Not Seasonally AdjustedS&P Cotality Case-Shiller MI-Detroit Home Price Index
Monthly, Not Seasonally AdjustedRelated Categories
Chicago-Naperville-Arlington Heights, IL
Metropolitan Divisions
Illinois
States
U.S. Regional Data
House Price Indexes
Prices
Seattle-Bellevue-Everett, WA
Metropolitan Divisions
Washington
Dallas-Plano-Irving, TX
Metropolitan Divisions
Texas
Los Angeles-Long Beach-Glendale, CA
Metropolitan Divisions
California
San Francisco-Redwood City-South San Francisco, CA
Detroit-Dearborn-Livonia, MI
Metropolitan Divisions
Michigan
Releases
More
Series from S&P Cotality Case-Shiller Home Price Indices
More
Series from State and Metro Area Employment, Hours, and Earnings
Tags
Chicago
S&P Cotality Case-Shiller Home Price Indices
S&P Dow Jones Indices LLC
Indiana
Wisconsin
Illinois
House Price Index
Copyrighted: Pre-Approval Required
Housing
Metropolitan Statistical Area
Price Index
Indexes
Seasonally Adjusted
Price
Monthly
United States of America
Metropolitan Division
Earnings
State and Metro Area Employment, Hours, and Earnings
Discontinued
Private
St. Louis Fed
Employment
Bureau of Labor Statistics
Public Domain: Citation Requested
Seattle
Washington (state)
Not Seasonally Adjusted
Annual
Dallas
Texas
Los Angeles
California
San Francisco
Detroit
Michigan