Notes
Source: Federal Reserve Bank of Dallas
Release: Trimmed Mean PCE Inflation Rate
Units:
Frequency:
Notes:
The Trimmed Mean PCE inflation rate produced by the Federal Reserve Bank of Dallas is an alternative measure of core inflation in the price index for personal consumption expenditures (PCE). The data series is calculated by the Dallas Fed, using data from the Bureau of Economic Analysis (BEA). Calculating the trimmed mean PCE inflation rate for a given month involves looking at the price changes for each of the individual components of personal consumption expenditures. The individual price changes are sorted in ascending order from “fell the most” to “rose the most,” and a certain fraction of the most extreme observations at both ends of the spectrum are thrown out or trimmed. The inflation rate is then calculated as a weighted average of the remaining components. The trimmed mean inflation rate is a proxy for true core PCE inflation rate. The resulting inflation measure has been shown to outperform the more conventional “excluding food and energy” measure as a gauge of core inflation.
Suggested Citation:
Federal Reserve Bank of Dallas, Trimmed Mean PCE Inflation Rate [PCETRIM12M159SFRBDAL], retrieved from FRED, Federal Reserve Bank of St. Louis; https://fred.stlouisfed.org/series/PCETRIM12M159SFRBDAL, .
Source: Organization for Economic Co-operation and Development
Release: Main Economic Indicators
Units:
Frequency:
Notes:
OECD Data Filters:
REF_AREA: USA
MEASURE: CPI
UNIT_MEASURE: IX
METHODOLOGY: N
EXPENDITURE: _TXCP01_NRG
ADJUSTMENT: N
TRANSFORMATION: _Z
FREQ: M
All OECD data should be cited as follows: OECD (year), (dataset name), (data source) DOI or https://data-explorer.oecd.org/. (accessed on (date)).
Suggested Citation:
Organization for Economic Co-operation and Development, Consumer Price Indices (CPIs, HICPs), COICOP 1999: Consumer Price Index: All Items Non-Food Non-Energy for United States [USACPICORMINMEI], retrieved from FRED, Federal Reserve Bank of St. Louis; https://fred.stlouisfed.org/series/USACPICORMINMEI, .
Source: U.S. Bureau of Economic Analysis
Release: Personal Income and Outlays
Units:
Frequency:
Notes:
BEA Account Code: DPCCRG
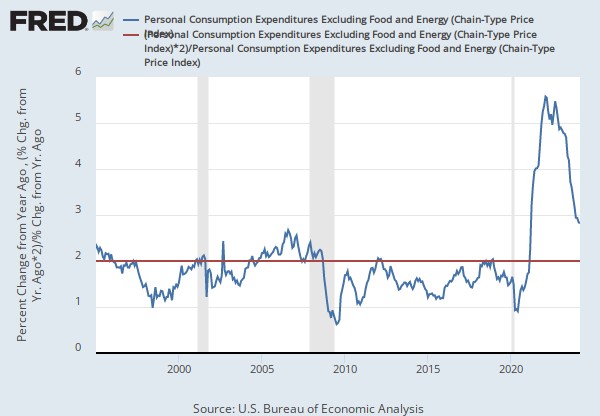
The Personal Consumption Expenditures Price Index is a measure of the prices that people living in the United States, or those buying on their behalf, pay for goods and services. The change in the PCE price index is known for capturing inflation (or deflation) across a wide range of consumer expenses and reflecting changes in consumer behavior. For example, if car prices rise, car sales may decline while bicycle sales increase.
The PCE Price Index is produced by the Bureau of Economic Analysis (BEA), which revises previously published PCE data to reflect updated information or new methodology, providing consistency across decades of data that's valuable for researchers. They also offer the series as a Chain-Type index and excluding food and energy products, as above. The PCE price index less food excluding food and energy is used primarily for macroeconomic analysis and forecasting future values of the PCE price index.
The PCE Price Index is similar to the Bureau of Labor Statistics' consumer price index for urban consumers. The two indexes, which have their own purposes and uses, are constructed differently, resulting in different inflation rates.
For more information on the PCE price index, see:
U.S. Bureau of Economic Analysis, Guide to the National Income and Product Accounts of the United States (NIPA)
U.S. Bureau of Economic Analysis, Personal Consumption Expenditures Price Index
U.S. Bureau of Economic Analysis, Prices & Inflation
U.S. Bureau of Labor Statistics, Differences between the Consumer Price Index and the Personal Consumption Expenditure Price Index
Suggested Citation:
U.S. Bureau of Economic Analysis, Personal Consumption Expenditures Excluding Food and Energy (Chain-Type Price Index) [PCEPILFE], retrieved from FRED, Federal Reserve Bank of St. Louis; https://fred.stlouisfed.org/series/PCEPILFE, .
Release Tables
Main Economic Indicators
Personal Income and Outlays
Related Data and Content
Data Suggestions Based On Your Search


Content Suggestions


Other Formats
Trimmed Mean PCE Inflation Rate
6-Month Annualized Percent Change, Monthly, Seasonally Adjusted Percent Change at Annual Rate, Monthly, Seasonally AdjustedConsumer Price Indices (CPIs, HICPs), COICOP 1999: Consumer Price Index: All Items Non-Food Non-Energy for United States
Growth rate same period previous year, Annual, Not Seasonally Adjusted Growth rate same period previous year, Monthly, Not Seasonally Adjusted Growth rate same period previous year, Quarterly, Not Seasonally Adjusted Annual, Not Seasonally Adjusted Monthly, Seasonally Adjusted Quarterly, Not Seasonally Adjusted Quarterly, Seasonally AdjustedPersonal Consumption Expenditures Excluding Food and Energy (Chain-Type Price Index)
Percent Change from Quarter One Year Ago, Quarterly, Seasonally AdjustedRelated Categories
Consumer Price Indexes (CPI and PCE)
Prices
Consumer Price Indexes
Prices
Indicators
United States
Countries
International Data
Price Indexes & Deflators
National Income & Product Accounts
National Accounts
Releases
More
Series from Trimmed Mean PCE Inflation Rate
More
Series from Main Economic Indicators
More
Series from Personal Income and Outlays
Tags
Trimmed Mean
Dallas Fed
Average
Personal Consumption Expenditures
Consumption Expenditures
Consumption
Personal
Inflation
Rate
Seasonally Adjusted
Copyrighted: Citation Required
Monthly
Nation
United States of America
Energy
All Items
Food
Consumer Price Index
Main Economic Indicators
Org. for Economic Co-operation and Development
Price Index
Indexes
Price
Not Seasonally Adjusted
Core Inflation
Chained
Headline Figure
National Income and Product Accounts
Bureau of Economic Analysis
Public Domain: Citation Requested