Notes
Source: Optimal Blue
Release: Optimal Blue Mortgage Market Indices
Units:
Frequency:
Notes:
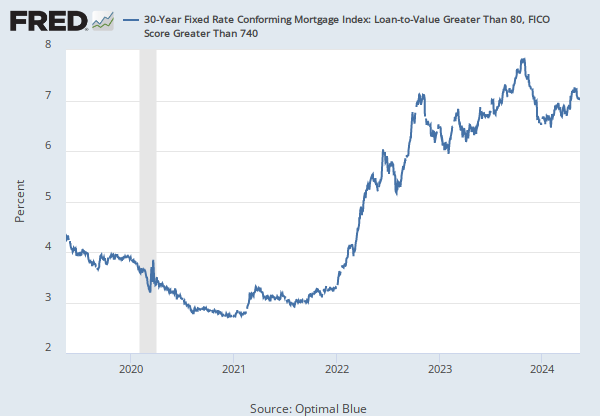
Optimal Blue Mortgage Market Indices™ (OBMMI™) is calculated from actual locked rates with consumers across over one-third of all mortgage transactions nationwide. OBMMI includes multiple mortgage pricing indices developed around the most popular products and specific borrower and loan level attributes.
Each index is calculated as the average of all appropriate rate locks locked through the Optimal Blue product eligibility and pricing engine on a given day. More details about methodology and definitions are available here.
Suggested Citation:
Optimal Blue, 30-Year Fixed Rate Conforming Mortgage Index [OBMMIC30YF], retrieved from FRED, Federal Reserve Bank of St. Louis; https://fred.stlouisfed.org/series/OBMMIC30YF, .
Source: Board of Governors of the Federal Reserve System (US)
Release: H.15 Selected Interest Rates
Units:
Frequency:
Notes:
For further information regarding treasury constant maturity data, please refer to the H.15 Statistical Release notes and Treasury Yield Curve Methodology.
For questions on the data, please contact the data source. For questions on FRED functionality, please contact us here.
Suggested Citation:
Board of Governors of the Federal Reserve System (US), Market Yield on U.S. Treasury Securities at 10-Year Constant Maturity, Quoted on an Investment Basis [DGS10], retrieved from FRED, Federal Reserve Bank of St. Louis; https://fred.stlouisfed.org/series/DGS10, .
Release Tables
H.15 Selected Interest Rates
Optimal Blue Mortgage Market Indices