Notes
Source: U.S. Bureau of Labor Statistics
Release: Consumer Price Index
Units:
Frequency:
Suggested Citation:
U.S. Bureau of Labor Statistics, Consumer Price Index for All Urban Consumers: Owners' Equivalent Rent of Primary Residence in U.S. City Average [CUUR0000SEHC01], retrieved from FRED, Federal Reserve Bank of St. Louis; https://fred.stlouisfed.org/series/CUUR0000SEHC01, .
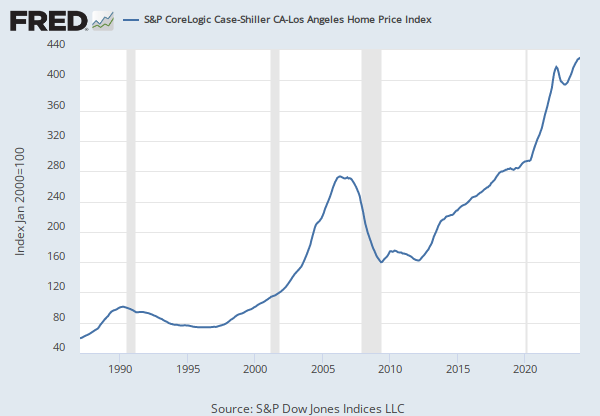
Source: S&P Dow Jones Indices LLC
Release: S&P Cotality Case-Shiller Home Price Indices
Units:
Frequency:
Notes:
For more information regarding the index, please visit Standard and Poor's.
Copyright © 2016, S&P Dow Jones Indices LLC. All rights reserved. Reproduction of S&P Case-Shiller 20-City Home Price Index in any form is prohibited except with the prior written permission of S&P Dow Jones Indices LLC "S&P". S&P does not guarantee the accuracy, adequacy, completeness or availability of any information and is not responsible for any errors or omissions, regardless of the cause or for the results obtained from the use of such information. S&P DISCLAIMS ANY AND ALL EXPRESS OR IMPLIED WARRANTIES, INCLUDING, BUT NOT LIMITED TO, ANY WARRANTIES OF MERCHANTABILITY OR FITNESS FOR A PARTICULAR PURPOSE OR USE. In no event shall S&P be liable for any direct, indirect, special or consequential damages, costs, expenses, legal fees, or losses (including lost income or lost profit and opportunity costs) in connection with subscriber's or others' user of S&P Case-Shiller 20-City Home Price Index.
Permission to reproduce this series can be requested from index_services@spdji.com. More contact details are available, including phone numbers for all regional offices.
Suggested Citation:
S&P Dow Jones Indices LLC, S&P Cotality Case-Shiller 20-City Composite Home Price Index [SPCS20RSA], retrieved from FRED, Federal Reserve Bank of St. Louis; https://fred.stlouisfed.org/series/SPCS20RSA, .
Source: U.S. Bureau of Economic Analysis
Release: Personal Income and Outlays
Units:
Frequency:
Notes:
BEA Account Code: DPCCRG
The Personal Consumption Expenditures Price Index is a measure of the prices that people living in the United States, or those buying on their behalf, pay for goods and services. The change in the PCE price index is known for capturing inflation (or deflation) across a wide range of consumer expenses and reflecting changes in consumer behavior. For example, if car prices rise, car sales may decline while bicycle sales increase.
The PCE Price Index is produced by the Bureau of Economic Analysis (BEA), which revises previously published PCE data to reflect updated information or new methodology, providing consistency across decades of data that's valuable for researchers. They also offer the series as a Chain-Type index and excluding food and energy products, as above. The PCE price index less food excluding food and energy is used primarily for macroeconomic analysis and forecasting future values of the PCE price index.
The PCE Price Index is similar to the Bureau of Labor Statistics' consumer price index for urban consumers. The two indexes, which have their own purposes and uses, are constructed differently, resulting in different inflation rates.
For more information on the PCE price index, see:
U.S. Bureau of Economic Analysis, Guide to the National Income and Product Accounts of the United States (NIPA)
U.S. Bureau of Economic Analysis, Personal Consumption Expenditures Price Index
U.S. Bureau of Economic Analysis, Prices & Inflation
U.S. Bureau of Labor Statistics, Differences between the Consumer Price Index and the Personal Consumption Expenditure Price Index
Suggested Citation:
U.S. Bureau of Economic Analysis, Personal Consumption Expenditures Excluding Food and Energy (Chain-Type Price Index) [PCEPILFE], retrieved from FRED, Federal Reserve Bank of St. Louis; https://fred.stlouisfed.org/series/PCEPILFE, .
Source: U.S. Bureau of Economic Analysis
Release: Gross Domestic Product
Units:
Frequency:
Notes:
BEA Account Code: A191RC
Gross domestic product (GDP), the featured measure of U.S. output, is the market value of the goods and services produced by labor and property located in the United States.For more information, see the Guide to the National Income and Product Accounts of the United States (NIPA) and the Bureau of Economic Analysis.
Suggested Citation:
U.S. Bureau of Economic Analysis, Gross Domestic Product [GDP], retrieved from FRED, Federal Reserve Bank of St. Louis; https://fred.stlouisfed.org/series/GDP, .
Release Tables
Consumer Price Index
Gross Domestic Product
- Table 1.1.5. Gross Domestic Product: Quarterly
- Table 1.2.5. Gross Domestic Product by Major Type of Product: Quarterly
- Table 1.3.5. Gross Value Added by Sector: Quarterly
- Table 1.4.5. Relation of Gross Domestic Product, Gross Domestic Purchases, and Final Sales to Domestic Purchasers: Quarterly
- Table 1.5.5. Gross Domestic Product, Expanded Detail: Quarterly
- Table 1.7.5. Relation of Gross Domestic Product, Gross National Product, Net National Product, National Income, and Personal Income: Quarterly
- Table 1.17.5. Gross Domestic Product, Gross Domestic Income, and Other Major NIPA Aggregates: Quarterly
Personal Income and Outlays
S&P Cotality Case-Shiller Home Price Indices
Related Data and Content
Data Suggestions Based On Your Search


Content Suggestions


Other Formats
Consumer Price Index for All Urban Consumers: Owners' Equivalent Rent of Primary Residence in U.S. City Average
Monthly, Seasonally Adjusted Semiannual, Not Seasonally AdjustedS&P Cotality Case-Shiller 20-City Composite Home Price Index
Monthly, Not Seasonally AdjustedPersonal Consumption Expenditures Excluding Food and Energy (Chain-Type Price Index)
Percent Change from Quarter One Year Ago, Quarterly, Seasonally AdjustedGross Domestic Product
Annual, Not Seasonally Adjusted Annual, Not Seasonally Adjusted Index 2017=100, Quarterly, Not Seasonally Adjusted Millions of Dollars, Quarterly, Not Seasonally Adjusted Percent Change from Preceding Period, Annual, Not Seasonally Adjusted Percent Change from Preceding Period, Quarterly, Seasonally Adjusted Annual RateRelated Categories
Housing
Consumer Price Indexes (CPI and PCE)
Prices
House Price Indexes
Price Indexes & Deflators
National Income & Product Accounts
National Accounts
GDP/GNP
Releases
More
Series from Consumer Price Index
More
Series from S&P Cotality Case-Shiller Home Price Indices
More
Series from Personal Income and Outlays
More
Series from Gross Domestic Product
Tags
Primary
Rent
Urban
Consumer
Consumer Price Index
Inflation
Price Index
Indexes
Price
Bureau of Labor Statistics
Monthly
Nation
Public Domain: Citation Requested
United States of America
Not Seasonally Adjusted
S&P Cotality Case-Shiller Home Price Indices
S&P Dow Jones Indices LLC
House Price Index
Copyrighted: Pre-Approval Required
Housing
Seasonally Adjusted
Core Inflation
Chained
Headline Figure
Energy
Personal Consumption Expenditures
Consumption Expenditures
Consumption
Personal
National Income and Product Accounts
Bureau of Economic Analysis
Gross Domestic Product
Quarterly