Notes
Source: Federal Reserve Bank of St. Louis
Release: Interest Rate Spreads
Units:
Frequency:
Notes:
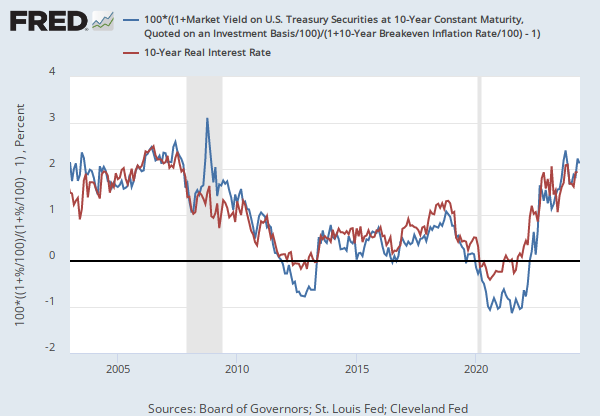
The breakeven inflation rate represents a measure of expected inflation derived from 10-Year Treasury Constant Maturity Securities (DGS10) and 10-Year Treasury Inflation-Indexed Constant Maturity Securities (DFII10). The latest value implies what market participants expect inflation to be in the next 10 years, on average.
Starting with the update on June 21, 2019, the Treasury bond data used in calculating interest rate spreads is obtained directly from the U.S. Treasury Department.
Suggested Citation:
Federal Reserve Bank of St. Louis, 10-Year Breakeven Inflation Rate [T10YIE], retrieved from FRED, Federal Reserve Bank of St. Louis; https://fred.stlouisfed.org/series/T10YIE, .
Source: Federal Reserve Bank of St. Louis
Release: Interest Rate Spreads
Units:
Frequency:
Notes:
Starting with the update on June 21, 2019, the Treasury bond data used in calculating interest rate spreads is obtained directly from the U.S. Treasury Department.
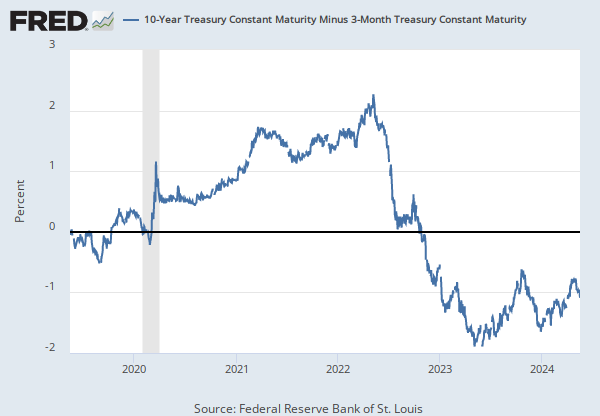
Series is calculated as the spread between 10-Year Treasury Constant Maturity (BC_10YEAR) and 2-Year Treasury Constant Maturity (BC_2YEAR). Both underlying series are published at the U.S. Treasury Department.
Suggested Citation:
Federal Reserve Bank of St. Louis, 10-Year Treasury Constant Maturity Minus 2-Year Treasury Constant Maturity [T10Y2Y], retrieved from FRED, Federal Reserve Bank of St. Louis; https://fred.stlouisfed.org/series/T10Y2Y, .
Source: Board of Governors of the Federal Reserve System (US)
Release: H.15 Selected Interest Rates
Units:
Frequency:
Notes:
For further information regarding treasury constant maturity data, please refer to the H.15 Statistical Release notes and the Treasury Yield Curve Methodology.
For questions on the data, please contact the data source. For questions on FRED functionality, please contact us here.
Suggested Citation:
Board of Governors of the Federal Reserve System (US), Market Yield on U.S. Treasury Securities at 20-Year Constant Maturity, Quoted on an Investment Basis, Inflation-Indexed [DFII20], retrieved from FRED, Federal Reserve Bank of St. Louis; https://fred.stlouisfed.org/series/DFII20, .
Release Tables
H.15 Selected Interest Rates
Related Data and Content
Data Suggestions Based On Your Search


Content Suggestions


Other Formats
10-Year Breakeven Inflation Rate
Monthly, Not Seasonally Adjusted10-Year Treasury Constant Maturity Minus 2-Year Treasury Constant Maturity
Monthly, Not Seasonally AdjustedMarket Yield on U.S. Treasury Securities at 20-Year Constant Maturity, Quoted on an Investment Basis, Inflation-Indexed
Annual, Not Seasonally Adjusted Monthly, Not Seasonally Adjusted Weekly, Not Seasonally AdjustedRelated Categories
Interest Rate Spreads
Interest Rates
Money, Banking, & Finance
Treasury Inflation-Indexed Securities
Treasury Constant Maturity
Releases
Tags
Spread
10-Year
Interest Rate
Interest
Daily
St. Louis Fed
Inflation
Rate
Copyrighted: Citation Required
Nation
United States of America
Not Seasonally Adjusted
2-Year
Yield Curve
Maturity
Treasury
20-Year
Treasury Inflation-Indexes Securities (TIPS)
H.15 Selected Interest Rates
Securities
Real
Board of Governors
Public Domain: Citation Requested